

Question: Refer to Table 14.1, which presents data on the hardnesses of welds produced from four different fluxes. a. There are six possible hypotheses to test
Refer to Table 14.1, which presents data on the hardnesses of welds produced from four different fluxes.
a. There are six possible hypotheses to test regarding pairs of fluxes. They are: H0: μ1 − μ2 = 0, H0: μ1 − μ3 = 0, H0: μ1 − μ4 = 0, H0: μ2 − μ3 = 0, H0: μ2 − μ4 = 0, and H0: μ3 − μ4 = 0.
Compute the value of the Bonferroni test statistic for each of these pairs.
b. Find the P-value for each of the tests, using the Student’s t distribution with N − I degrees of freedom. The alternatives are two-tailed.
c. Use the Bonferroni correction to determine which pairs of means, if any, differ at the α = 0.05 level of significance.
d. Compare the results of the Bonferroni correction with the results of the Tukey–Kramer test.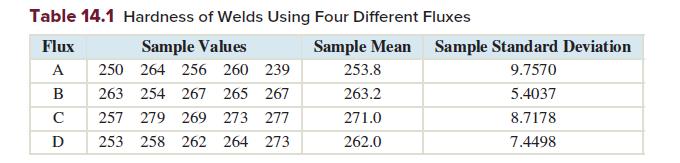
Table 14.1 Hardness of Welds Using Four Different Fluxes Flux Sample Values Sample Mean Sample Standard Deviation A 250 264 256 260 239 253.8 9.7570 B 263 254 267 265 267 263.2 5.4037 C 257 279 269 273 277 271.0 8.7178 D 253 258 262 264 273 262.0 7.4498
Step by Step Solution
3.50 Rating (150 Votes )
There are 3 Steps involved in it

Get step-by-step solutions from verified subject matter experts