

Question: Skillbuilder Applet Exercise provide practice in constructing scatter diagrams to match given correlation coefficients. a. After placing just 2 points, what is the calculated r
Skillbuilder Applet Exercise provide practice in constructing scatter diagrams to match given correlation coefficients.
a. After placing just 2 points, what is the calculated r value for each scatter diagram?
Why?
b. Which scatter diagram did you find easier to construct?
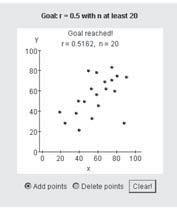
1001 80- 60 401 20 Goat - 0.5 with n at least 20 Goal reached 0.5162, 20 0 20 20 40 60 80 100 Add points Delete points Clear
Step by Step Solution
There are 3 Steps involved in it
1 Expert Approved Answer
Step: 1 Unlock

Question Has Been Solved by an Expert!
Get step-by-step solutions from verified subject matter experts
Step: 2 Unlock
Step: 3 Unlock