

Question: The following graph shows the relationship between three variables: number of licensed drivers, number of registered vehicles, and the size of the resident population for
The following graph shows the relationship between three variables: number of licensed drivers, number of registered vehicles, and the size of the resident population for the United States from 1961 to 2003. Study the graph and answer these questions:
a. Does it seem reasonable that the Population line and the Drivers line run basically parallel to each other and that the Population line is above the Drivers line? Explain what it means for them to be parallel. What would it mean if they were not parallel?
b. The Drivers and Motor Vehicles lines cross.
What does this mean? When do the lines intersect, and what does the point of intersection represent?
c. Explain the relationship between motor vehicles and drivers before 1973.
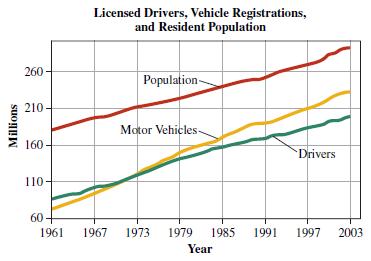
d. Explain the relationship between motor vehicles and drivers after 1973.
e. Do you predict drivers will ever surpass motor vehicles after 2003? Why or why not?
f. Using the years 1982 and 2000, estimate the slopes of the Motor Vehicles line and the Drivers line. Compare and contrast the slopes found.
Millions 260 Licensed Drivers, Vehicle Registrations, and Resident Population Population- 210- Motor Vehicles- 160 110- Drivers 60- 1961 1967 1973 1979 1985 1991 Year 1997 2003
Step by Step Solution
There are 3 Steps involved in it

Get step-by-step solutions from verified subject matter experts