

Question: Skillbuilder Applet Exercise simulates sampling from a skewed population, where 6.029 and 10.79. a. Change the # Observations per sample to 4. Using batch and
Skillbuilder Applet Exercise simulates sampling from a skewed population, where 6.029 and 10.79.
a. Change the “# Observations per sample”
to “4.” Using batch and 500, take 1000 samples of size 4.
b. Compare the mean and standard deviation for the sample means with and . Compare the sample standard deviation with , which is 10.79/4. Does the histogram have an approximately normal shape? If not, what shape is it?
c. Using the “clear” button each time, repeat the directions in parts a and b for samples of size 25, 100, and 1000. Table your findings for each sample size.
d. Relate your findings to the SDSM and the CLT.
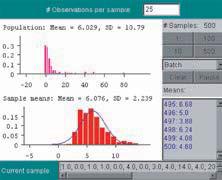
Population: Mean 6.029, 30 -10.79 0.3 0.2 0.1 #Observations per samp 25 #Samples 500 300 800 Batch -200 20 40 60 80 Sample means: Mean 6.076, 02.239 0.15 495.6.68 436:5.0 497 388 0.1 0.05 498624 4994.08 500 4.60 10 10,00 10 10 00, 40,00, 30, 40, 140, 40, 20- Current sample
Step by Step Solution
There are 3 Steps involved in it

Get step-by-step solutions from verified subject matter experts