

Question: Testing for Correlation Use the information provided in the display to determine the value of the linear correlation coefficient. Given that there are 40 pairs
Testing for Correlation Use the information provided in the display to determine the value of the linear correlation coefficient. Given that there are 40 pairs of data, is there sufficient evidence to support a claim of a linear correlation between foot lengths of people and their heights?
Interpreting a Computer Display. In Exercises 9–12, refer to the display obtained by using the paired data consisting of foot lengths (cm) and heights (cm) of 40 people .
(Unlike the examples in this section, these exercises use foot lengths instead of shoe print lengths.) Along with the paired sample data, a foot length of 29.0 cm is used for predicting height.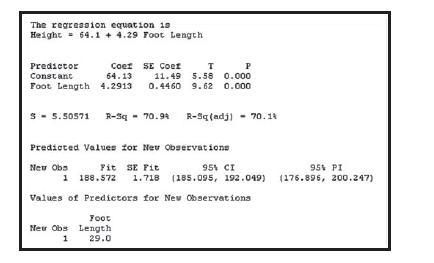
The regression equation is Height 64.1 +4.29 Foot Length Predictor Constant Coef SE Coef 64.13 11.49 5.58 0.4460 T P 0.000 9.62 0.000 Foot Length 4.2913 5-5.50571 R-Sq - 70.9 R-Sq (adj) 70.14 Predicted Values for New Observations New Obs Fit SE Fit 1 188.572 1.718 95% CI (185.095, 192.049) 95% PI (176.896, 200.247) Values of Predictors for New Observations Foot New Obs Length 1 29.0
Step by Step Solution
There are 3 Steps involved in it

Get step-by-step solutions from verified subject matter experts