

Question: Testing Goodness-of-Fit with a Normal Distribution Refer to Data Set 1 in Appendix: Data Sets for the 40 heights of females. a. Enter the observed
Testing Goodness-of-Fit with a Normal Distribution Refer to Data Set 1 in Appendix:
Data Sets for the 40 heights of females.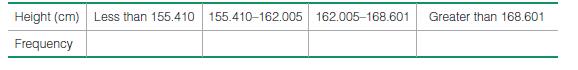
a. Enter the observed frequencies in the preceding table.
b. Assuming a normal distribution with mean and standard deviation given by the sample mean and standard deviation, find the probability of a randomly selected height belonging to each class.
c. Using the probabilities found in part (b), find the expected frequency for each category.
d. Use a 0.01 significance level to test the claim that the heights were randomly selected from a normally distributed population. Does the goodness-of-fit test suggest that the data are from a normally distributed population?
Height (cm) Less than 155.410 155.410-162.005 162.005-168.601 Greater than 168.601 Frequency
Step by Step Solution
There are 3 Steps involved in it

Get step-by-step solutions from verified subject matter experts