

Refer to Data Set 1 Body Data in Appendix B for the heights of females. a. Enter
Question:
Refer to Data Set 1 “Body Data” in Appendix B for the heights of females.
![]()
a. Enter the observed frequencies in the table above.
b. Assuming a normal distribution with mean and standard deviation given by the sample mean and standard deviation, use the methods of Chapter 6 to find the probability of a randomly selected height belonging to each class.
c. Using the probabilities found in part (b), find the expected frequency for each category.
d. Use a 0.01 significance level to test the claim that the heights were randomly selected from a normally distributed population. Does the goodness-of-fit test suggest that the data are from a normally distributed population?
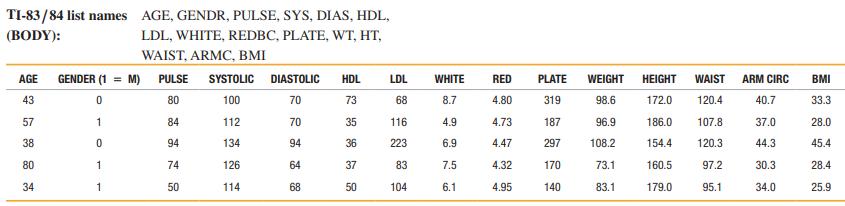
Data Set 1: Body Data
Body and exam measurements are from 300 subjects (first five rows shown here). AGE is in years, for GENDER 1 = male and 0 = female, PULSE is pulse rate (beats per minute), SYSTOLIC is systolic blood pressure (mm Hg), DIASTOLIC is diastolic blood pressure (mm Hg), HDL is HDL cholesterol (mg/dL), LDL is LDL cholesterol (mg/dL), WHITE is white blood cell count (1000 cells/mL), RED is red blood cell count (million cells/mL), PLATE is platelet count (1000 cells/mL), WEIGHT is weight (kg), HEIGHT is height (cm), WAIST is waist circumference (cm), ARM CIRC is arm circumference (cm), and BMI is body mass index (kg/m2). Data are from the National Center for Health Statistics.
Step by Step Answer:


Mathematical Interest Theory
ISBN: 9781470465681
3rd Edition
Authors: Leslie Jane, James Daniel, Federer Vaaler
