

Question: The author collected the data in the table below by randomly selecting cars in Connecticut and New York. Use a 0.05 significance level to test
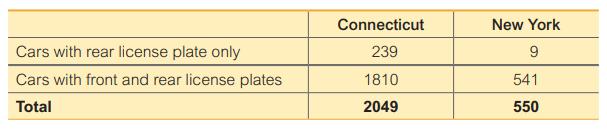
The author collected the data in the table below by randomly selecting cars in Connecticut and New York. Use a 0.05 significance level to test the claim that Connecticut and New York have the same proportion of cars with rear license plates only.
a. Test the claim using a hypothesis test.
b. Test the claim by constructing an appropriate confidence interval.
Cars with rear license plate only Cars with front and rear license plates Total Connecticut 239 1810 2049 New York 9 541 550
Step by Step Solution
3.38 Rating (157 Votes )
There are 3 Steps involved in it
a H o P P H P P 2 population Connecticut cars population 2 New York cars Test s... View full answer

Get step-by-step solutions from verified subject matter experts