

Question: The following boxplot represents a sample from a population. Is it reasonable to assume that this population is approximately normal? 50 50 55 60 00
The following boxplot represents a sample from a population. Is it reasonable to assume that this population is approximately normal?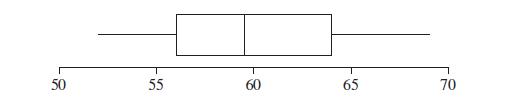
50 50 55 60 00 55 65 70 10
Step by Step Solution
There are 3 Steps involved in it
1 Expert Approved Answer
Step: 1 Unlock

Question Has Been Solved by an Expert!
Get step-by-step solutions from verified subject matter experts
Step: 2 Unlock
Step: 3 Unlock