

Question: The following figure is a probability density curve that represents the grade point averages (GPA) of the graduating seniors at a large university. a. Find
The following figure is a probability density curve that represents the grade point averages (GPA) of the graduating seniors at a large university.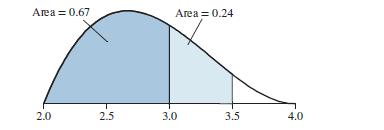
a. Find the proportion of seniors whose GPA is between 3.0 and 3.5.
b. What is the probability that a randomly chosen senior will have a GPA greater than 3.5?
Area = 0.67 Area = 0.24 2.0 2.5 3.0 3.5 4.0
Step by Step Solution
★★★★★
3.47 Rating (154 Votes )
There are 3 Steps involved in it
1 Expert Approved Answer
Step: 1 Unlock

Question Has Been Solved by an Expert!
Get step-by-step solutions from verified subject matter experts
Step: 2 Unlock
Step: 3 Unlock