

Question: The following figure is a probability density curve that represents the lifetime, in months, of a certain type of laptop battery. a. Find the proportion
The following figure is a probability density curve that represents the lifetime, in months, of a certain type of laptop battery.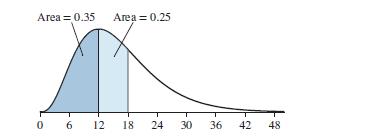
a. Find the proportion of batteries with lifetimes between 12 and 18 months.
b. Find the proportion of batteries with lifetimes less than 18 months.
c. What is the probability that a randomly chosen battery lasts more than 18 months?
Area = 0.35 Area = 0.25 06 12 18 24 30 36 42 48
Step by Step Solution
★★★★★
3.58 Rating (151 Votes )
There are 3 Steps involved in it
1 Expert Approved Answer
Step: 1 Unlock

Question Has Been Solved by an Expert!
Get step-by-step solutions from verified subject matter experts
Step: 2 Unlock
Step: 3 Unlock