

Question: The following MINITAB output presents a confidence interval for a mean response and a prediction interval for an individual response. a. Predict the value of
The following MINITAB output presents a confidence interval for a mean response and a prediction interval for an individual response.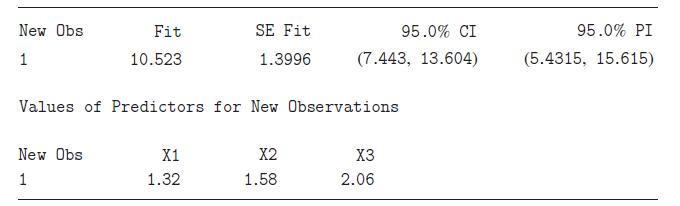
a. Predict the value of y when x1 = 1.32, x2 = 1.58, and x3 = 2.06.
b. We are 95% confident that an individual whose values are x1 = 1.32, x2 = 1.58, and x3 = 2.06 will have a response between _________________ and _______________ .
c. We are 95% confident that the mean response when x1 = 1.32, x2 = 1.58, and x3 = 2.06 is between _________________ and __________________ .
New Obs Fit 1 10.523 SE Fit 1.3996 95.0% CI (7.443, 13.604) Values of Predictors for New Observations New Obs X1 X2 X3 1 1.32 1.58 2.06 95.0% PI (5.4315, 15.615)
Step by Step Solution
There are 3 Steps involved in it

Get step-by-step solutions from verified subject matter experts