

Question: The following MINITAB output presents a multiple regression equation. a. What percentage of the variation in the response is explained by the multiple regression equation?
The following MINITAB output presents a multiple regression equation.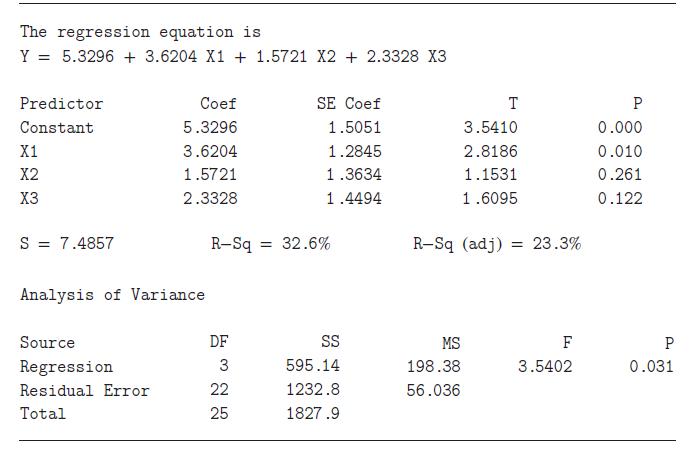
a. What percentage of the variation in the response is explained by the multiple regression equation?
b. What percentage of the variation in the response is explained by the multiple regression equation, if we account for the number of explanatory variables in the model?
The regression equation is Y5.3296 +3.6204 X1 + 1.5721 X2 +2.3328 X3 Predictor Coef SE Coef T P Constant 5.3296 1.5051 3.5410 0.000 X1 3.6204 1.2845 2.8186 0.010 X2 1.5721 1.3634 1.1531 0.261 X3 2.3328 1.4494 1.6095 0.122 S = 7.4857 R-Sq = 32.6% R-Sq (adj) 23.3% = Analysis of Variance. Source DF SS MS F P Regression 3 595.14 198.38 3.5402 0.031 Residual Error 22 1232.8 56.036 Total 25 1827.9
Step by Step Solution
3.37 Rating (150 Votes )
There are 3 Steps involved in it
Part a Rsquare refers to the percentage of the variation in the re... View full answer

Get step-by-step solutions from verified subject matter experts