

The following table presents amounts of particulate emissions for 65 vehicles. These data also appear in Table
Question:
The following table presents amounts of particulate emissions for 65 vehicles. These data also appear in Table 2.18.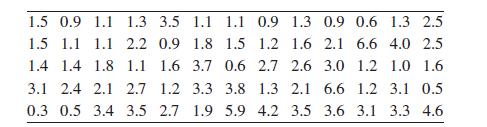
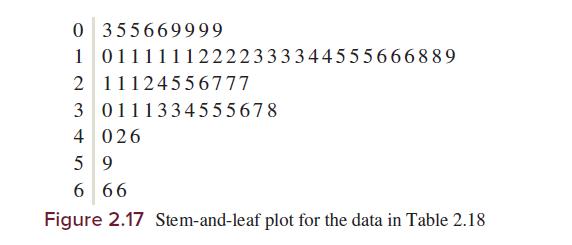
a. Construct a split stem-and-leaf plot in which each stem appears twice, once for leaves 0–4 and again for leaves 5–9.
b. Compare the split stem-and-leaf plot to the plot in Figure 2.17. Comment on the advantages and disadvantages of the split stem-and-leaf plot for these data.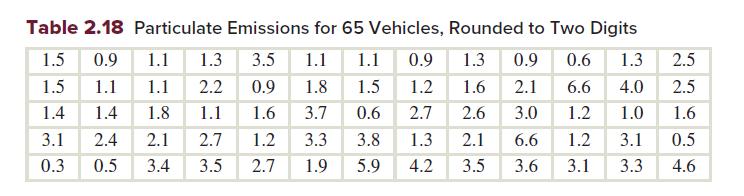
Step by Step Answer:

This question has not been answered yet.
You can Ask your question!
Related Book For 

Question Posted:
