

The following table presents the ages of the last 10 U.S. presidents and their wives on the
Question:
The following table presents the ages of the last 10 U.S. presidents and their wives on the first day of their presidencies.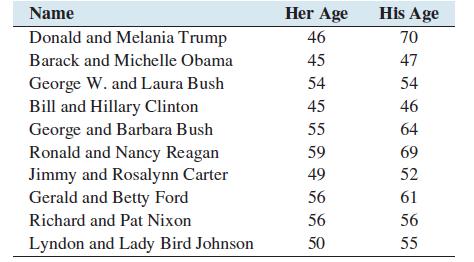
a. Compute the least-squares regression line for predicting the president’s age from the first lady’s age.
b. Compute the coefficient of determination.
c. Construct a scatterplot of the presidents’ ages (y) versus the first ladies’ ages (x).
d. Which point is an outlier?
e. Remove the outlier and compute the least-squares regression line for predicting the president’s age from the first lady’s age.
f. Is the outlier influential? Explain.
g. Compute the coefficient of determination for the data set with the outlier removed. Is the proportion of variation explained by the least-squares regression line greater, less, or about the same without the outlier?
Explain.
Step by Step Answer:


