

Question: The following table presents the average ticket price (the average price paid per attendee) in dollars and the gross revenue (in millions of dollars) for
The following table presents the average ticket price (the average price paid per attendee) in dollars and the gross revenue (in millions of dollars) for Broadway productions for each of 20 seasons.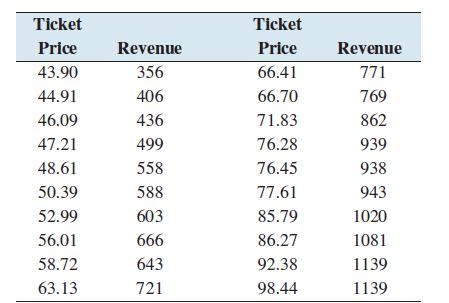
a. Compute the least-squares regression line for predicting gross revenue (y) from ticket price (x).
b. Compute the coefficient of determination.
c. Construct a residual plot. Does the relationship appear to be linear?
d. True or false: If the coefficient of determination is large, the relationship must be linear.
Ticket Ticket Price Revenue Price Revenue 43.90 356 66.41 771 44.91 406 66.70 769 46.09 436 71.83 862 47.21 499 76.28 939 48.61 558 76.45 938 50.39 588 77.61 943 52.99 603 85.79 1020 56.01 666 86.27 1081 58.72 643 92.38 1139 63.13 721 98.44 1139
Step by Step Solution
3.32 Rating (158 Votes )
There are 3 Steps involved in it

Get step-by-step solutions from verified subject matter experts