

The following table presents the weekly attendance, in thousands, at Broadway shows during a recent season. a.
Question:
The following table presents the weekly attendance, in thousands, at Broadway shows during a recent season.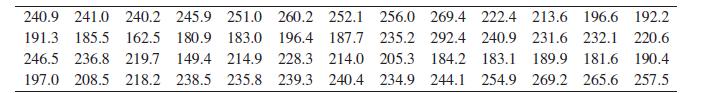
a. Find the mean and median weekly attendance.
b. Based on the mean and median, would you expect that a histogram would be skewed to the left, skewed to the right, or approximately symmetric? Explain.
c. Construct a frequency histogram. Do the results agree with your expectation?
Fantastic news! We've Found the answer you've been seeking!
Step by Step Answer:

Answered By
SREEJIT UNNI
I have worked in substations so basically students used to come there and do their interns. Since I have a passion for teaching I used to teach them the fundamentals and clear their doubts. It is one of the ways of sharing information according to my vision. In my opinion for tutoring, all you need is to have Passion, Sound knowledge of what you are saying and discipline.
0 Reviews
10+ Question Solved
Related Book For 

Question Posted:
