

Question: Use the sample data to construct a scatterplot. Use the first variable for the x-axis. Based on the scatterplot, what do you conclude about a
Use the sample data to construct a scatterplot. Use the first variable for the x-axis. Based on the scatterplot, what do you conclude about a linear correlation?
The table lists pulse rates (beats per minute) from randomly selected females and randomly selected males. What is a major and fundamental flaw with this exercise?
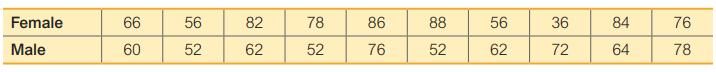
Female Male 66 60 56 52 82 62 78 52 86 76 8888 52 56 62 36 72 84 64 76 78
Step by Step Solution
★★★★★
3.39 Rating (155 Votes )
There are 3 Steps involved in it
1 Expert Approved Answer
Step: 1 Unlock

There does not appear to be a correlation between ... View full answer
Question Has Been Solved by an Expert!
Get step-by-step solutions from verified subject matter experts
Step: 2 Unlock
Step: 3 Unlock