

Question: Use the time>tip data from the table below, which includes data from New York City taxi rides (from Data Set 32 Taxis in Appendix B).
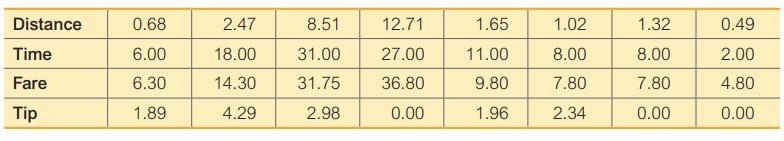
Use the time>tip data from the table below, which includes data from New York City taxi rides (from Data Set 32 “Taxis” in Appendix B). (The distances are in miles, the times are in minutes, the fares are in dollars, and the tips are in dollars.) Find the best predicted tip for a ride that takes 20 minutes. How does the result compare to the actual tip amount of $4.55?
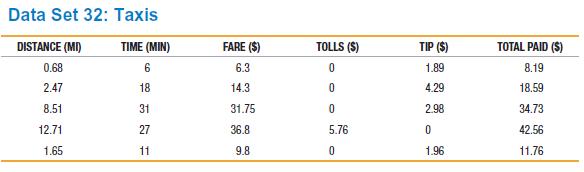
Data Set 32: Taxis DISTANCE (MI) TIME (MIN) 0.68 6 2.47 18 8.51 31 12.71 27 1.65 11 FARE ($) 6.3 14.3 31.75 36.8 9.8 TOLLS ($) 0 0 0 5.76 0 TIP ($) 1.89 4.29 2.98 0 1.96 TOTAL PAID ($) 8.19 18.59 34.73 42.56 11.76
Step by Step Solution
3.38 Rating (160 Votes )
There are 3 Steps involved in it
10600452x r 0298 Pvalue 0473 With no significant linear ... View full answer

Get step-by-step solutions from verified subject matter experts