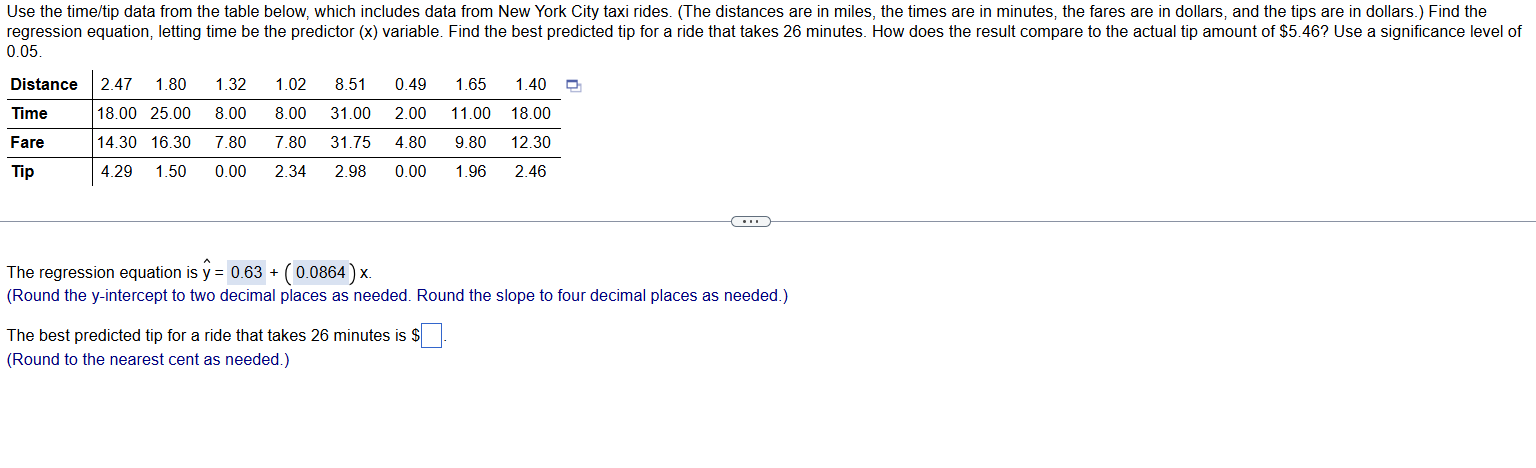
Question: Use the time/tip data from the table below, which includes data fram New York City taxi rides. (The distances are in miles, the times are

Use the time/tip data from the table below, which
Use the time/tip data from the table below, which includes data fram New York City taxi rides. (The distances are in miles, the times are in minutes, the fares are in dollars, and the tips are in dollars.) Find the regression equation, letting time be the predictor (x) variable. Find the best predicted tip for a ride that takes 26 minutes. How does the result compare to the actual tip amount of $5.46? Use a significance level of 0.05. Distance | 247 180 132 102 851 049 165 140 5 Time 18.00 25.00 600 800 31.00 200 11.00 18.00 Fare 1430 1630 780 780 3175 480 980 12.30 Tip 429 150 000 234 298 000 196 246 The regression equation is y = 0.63 + ( 0.0864 ) x. (Round the y-intercept to two decimal places as needed. Round the slope to four decimal places as needed.) The best predicted tip for a ride that takes 26 minutes is $| (Round to the nearest cent as needed.)

Step by Step Solution

There are 3 Steps involved in it

1 Expert Approved Answer
Step: 1 Unlock blur-text-image
Question Has Been Solved by an Expert!

Get step-by-step solutions from verified subject matter experts

Step: 2 Unlock
Step: 3 Unlock

Students Have Also Explored These Related Accounting Questions!