

Question: Prove (graphically) that the point labeled e* in Figure 5.6 is indeed the point that minimizes total social costs, the sum of abatement and damage
Prove (graphically) that the point labeled e* in Figure 5.6 is indeed the point that minimizes total social costs, the sum of abatement and damage costs.
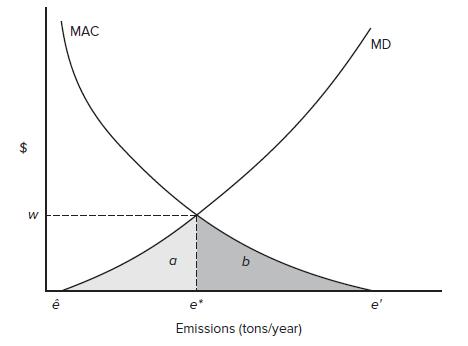
$ W D MAC DES a 1 e b Emissions (tons/year) MD e'
Step by Step Solution
★★★★★
3.40 Rating (166 Votes )
There are 3 Steps involved in it
1 Expert Approved Answer
Step: 1 Unlock

Minimum social cost would be achieved at the point of intersection between t... View full answer
Question Has Been Solved by an Expert!
Get step-by-step solutions from verified subject matter experts
Step: 2 Unlock
Step: 3 Unlock