

Question: Q1) Prove (graphically) that the point labeled 3* in Figure 5.6 is indeed the point that minimizes total social costs, the sum of abatement and
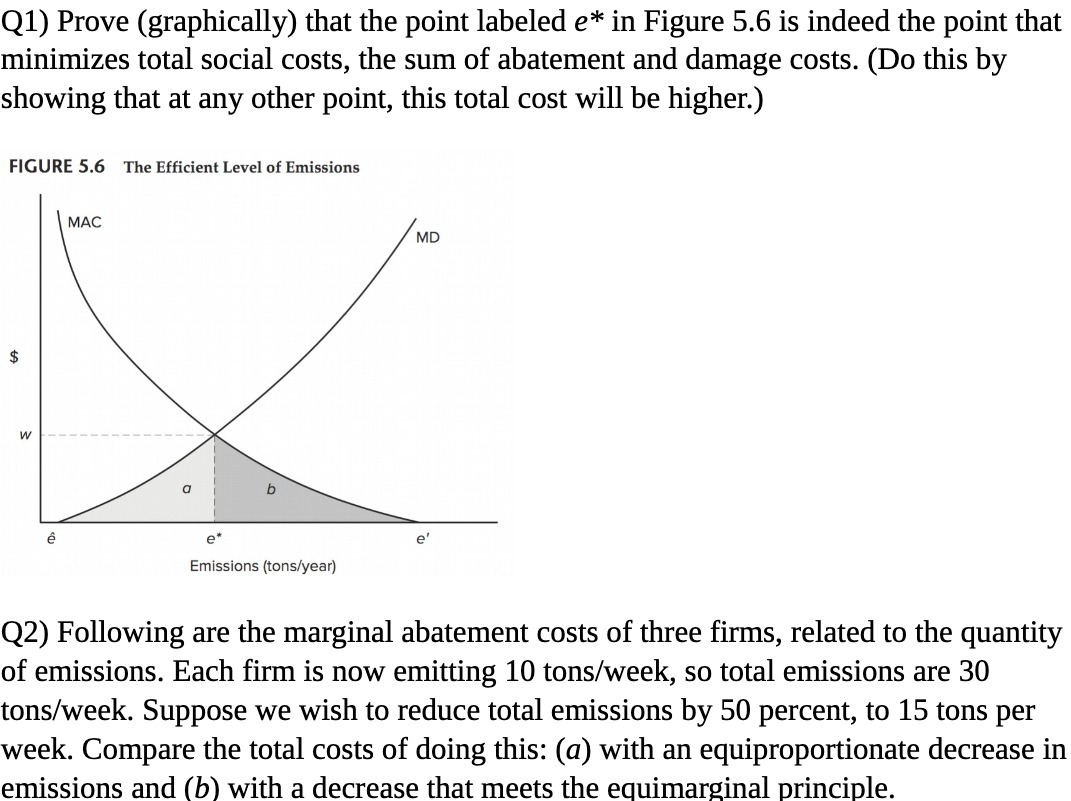
Q1) Prove (graphically) that the point labeled 3* in Figure 5.6 is indeed the point that minimizes total social costs, the sum of abatement and damage costs. (Do this by showing that at any other point, this total cost will be higher.) FIGURE 5.6 The Efcient Level of Emissions Emissions {tonsiyear} Q2) Following are the marginal abatement costs of three firms, related to the quantity of emissions. Each firm is now emitting 10 tons/week, so total emissions are 30 tons/week. Suppose we wish to reduce total emissions by 50 percent, to 15 tons per week. Compare the total costs of doing this: (a) with an equiproportionate decrease in emissions and ( b) with a decrease that meets the equimarginal principle
Step by Step Solution
There are 3 Steps involved in it

Get step-by-step solutions from verified subject matter experts