

Refer to Figure 4. 1 in the textbook. Based on this graph, it is argued that the
Question:
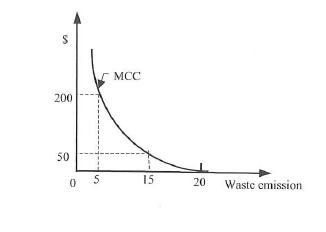
Refer to Figure 4. 1 in the textbook. Based on this graph, it is argued that the marginal cost of controlling pollution increases with the successive increase in pollution clean-up. What could explain this feature of the MCC? Can you provide an example to support this reality?
Data from Figure 4. 1
Step by Step Answer:

This question has not been answered yet.
You can Ask your question!
Related Book For 
Principles Of Environmental Economics And Sustainability
ISBN: 9780815363545
4th Edition
Authors: Ahmed Hussen
Question Posted:
