The worldwide tablet market experienced a major technological development with the introduction of the Apple iPad in
Question:
The worldwide tablet market experienced a major technological development with the introduction of the Apple iPad in April 2010, which has important implications for the personal computer (PC) industry. A tablet can be thought of as a portable personal computer with a touchscreen interface instead of a keyboard, which is commonly used as the input device in traditional PCs. Another distinguishing feature of tablets is that, unlike the majority of PCs that run on the Microsoft Windows platform, most tablets run on a non-Microsoft operating system, including Apple’s iOS and Google’s Android.
Given the tablet’s ability to perform many of the most common tasks of a PC, including e-mailing, browsing the web, sharing photos, playing music, watching movies, playing games, keeping a calendar, managing contacts, and so on, an analyst might reasonably wonder to what extent sales of tablets might cannibalize demand for PCs and the potential impact that might have on Microsoft’s sales and earnings. Exhibit 31 presents one approach to answering these questions.
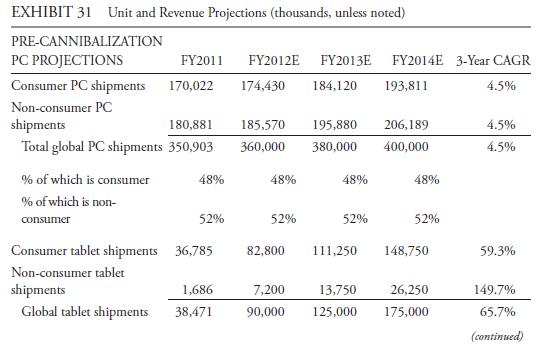
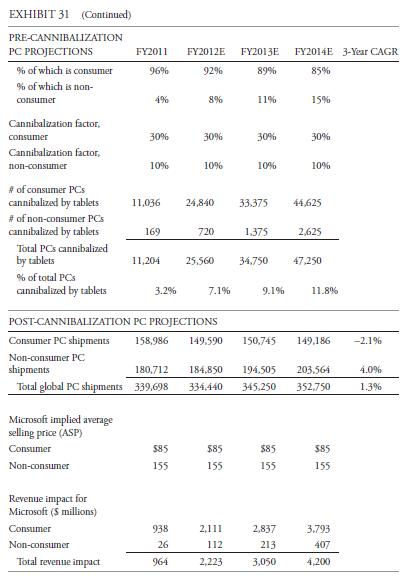
and worldwide shipments of tablets were 38.5 million units.10 Shipments of tablets to consumers represented 96% of total shipments during fiscal year 2011. Next, we estimate the magnitude of the potential substitution effect, or cannibalization factor, that tablets will have on the PC market. Because the cannibalization factor depends on many different variables, including user preferences, end-use application, and whether the purchaser already owns a PC, just to name a few, we use a range of potential estimates.
Moreover, we also divide the worldwide PC market into consumer and non-consumer (enterprise, education, and government purchasers) because the degree of substitution is likely to differ between the two. For purposes of illustration, we assume a cannibalization factor of 30% for the consumer market and 10% for the non-consumer market in our base case scenario.
In addition, the base case scenario assumes that non-consumer adoption of tablets increases to 15% of the market from 4% in 2011. Moreover, although the composition of the global PC market is roughly evenly divided between consumers and non-consumers (48% and 52% in fiscal 2011, respectively), the non-consumer segment is significantly more profitable for Microsoft because approximately 80%
of the company’s Office products are sold to enterprise, education, and government institutions. The average selling price (ASP) estimates are derived by dividing Microsoft’s estimated average revenue for the prior three years by customer type by Microsoft’s estimated PC shipments for each type of customer. By multiplying the projected number of PCs cannibalized by tablets by the estimated ASP, we are able to derive an estimate of the revenue impact for Microsoft. For example, in FY2012 it is projected that 24.8 million consumer PCs will be cannibalized by sales of tablets. With an average consumer ASP of \($85\), this cannibalization implies a revenue loss for Microsoft of \($2.1\) billion (24.8 million units × \($85\) ASP per unit = \($2.1\) billion).
Once the revenue impact has been projected, the next step is to estimate the impact of lower PC unit volumes on operating costs and margins. We begin by analyzing the cost structure of Microsoft, and more specifically, the breakdown between fixed and variable costs. Most software companies have a cost structure with a relatively high proportion of fixed costs and a low proportion of variable costs because costs related to product development and marketing (mostly fixed) are sunk and unrecoverable whereas the cost of producing an additional copy of the software (mostly variable) is relatively low. Because very few, if any, companies provide an explicit breakdown of fixed versus variable costs, an estimate almost always needs to be made. One method is to use the formula 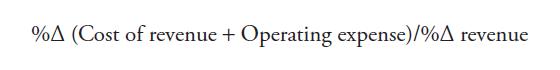
where %Δ is “percent change in,” as a proxy for variable cost percentage. Another approach is to assign an estimate of the percentage of fixed and variable costs to the various components of operating expenses. Both approaches are illustrated in Exhibits 32 and 33.
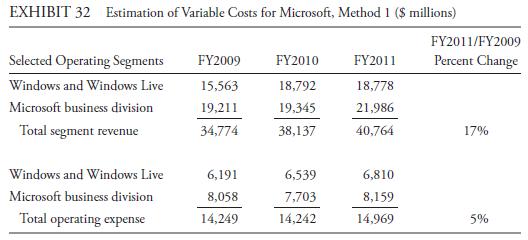
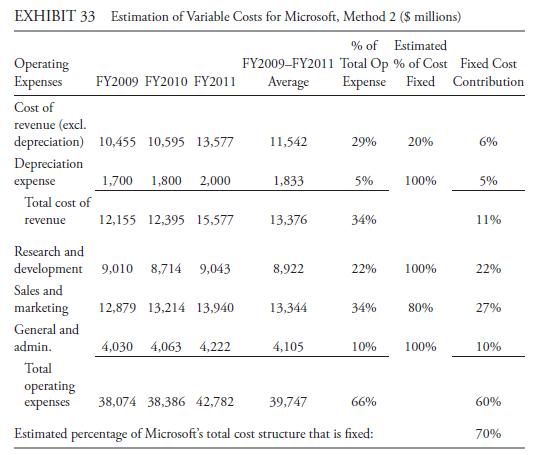
As can be seen, Microsoft’s cost structure appears to consist of approximately 70%
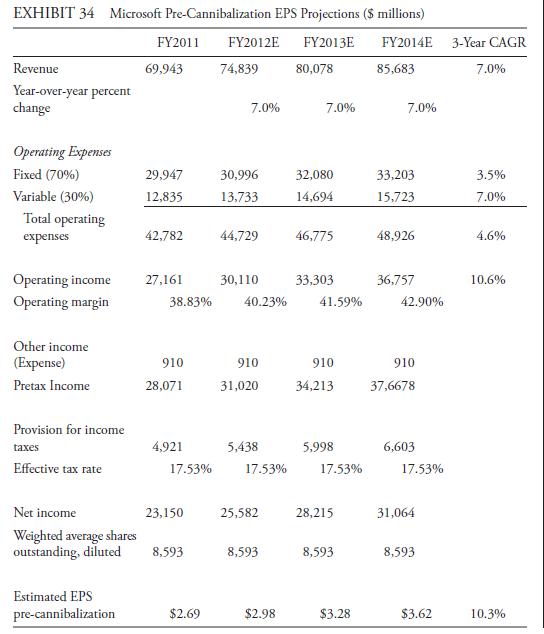
fixed costs and 30% variable costs. Note, however, that a growing company like Microsoft will typically re-invest in property, plant, and equipment to support future growth, so even those expenses that appear to be “fixed” will increase over time. To adjust for this expected growth in fixed costs, this example includes an assumption that the change in fixed costs will be half the rate of the change in sales. Variable costs are projected to change at the same rate as sales. As shown in Exhibit 34, after incorporating these assumptions into the projections, an assumed 7.0% compound annual growth rate (CAGR ) in revenue through FY2014 would translate into a 10.6% CAGR in operating income [(36,757/27,161)1/3 ‒ 1 = 0.106, or 10.6%]. In addition, these assumptions would result in an operating margin expansion of 410 bps over the same period (42.9%
− 38.8% = 4.1%, or 410 bps) because of the significant amount of operating leverage that exists as a result of a relatively large fixed cost base. With the further assumptions of no change in other income, a constant effective tax rate, and no change in shares outstanding, the pre-cannibalization model Exhibit 34 results in projected revenue of \($85.7\) billion, operating income of \($36.8\) billion, an operating margin of 42.9%, and earnings per share (EPS) that increases at a CAGR of 10.3% to \($3.62\) in FY2014.
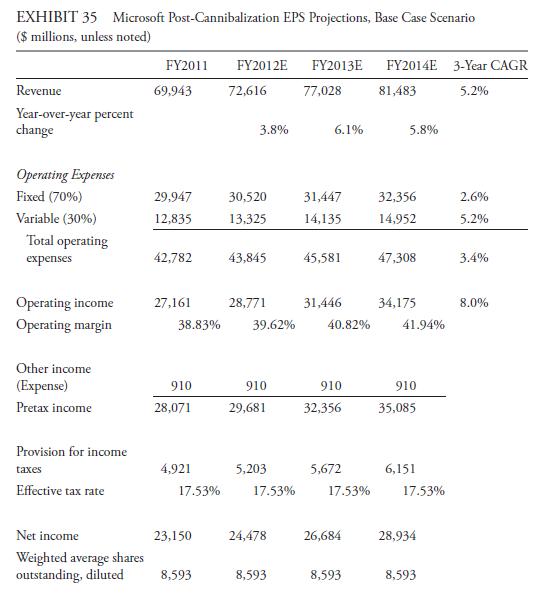
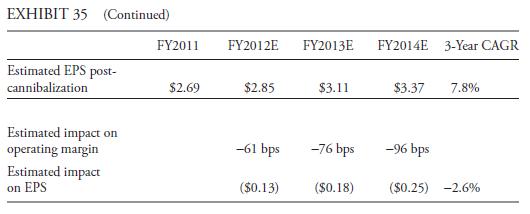
In the post-cannibalization scenario, as shown in Exhibit 35, revenue is reduced each year to reflect the expected impact from cannibalization. The expected impact of cannibalization results in a decrease in the CAGR of revenue over the period to 5.2%, down from 7.0% in the pre-cannibalization scenario. Given the reduction in revenue growth, and holding the cost structure constant at 70/30 fixed versus variable costs, operating income growth slows to a CAGR of 8.0%, down from 10.6% in the pre-cannibalization scenario. Operating margin at the end of the period is reduced by approximately 100 bps from 42.9% to 41.9% because the company is unable to leverage its fixed cost base to the same degree as a result of slower revenue growth. Overall, in the post-cannibalization scenario, Microsoft is expected to generate revenue of \($81.5\) billion, operating income of \($34.2\) billion, an operating margin of 41.9%, and EPS that increase at a CAGR of 7.8% to \($3.37\) in FY2014. Thus, the cannibalization of PCs as a result of projected growth in the tablet market is expected to reduce the company’s annual revenues in FY2014 by \($4.2\) billion, operating income by \($2.6\) billion, operating margins by 96 bps, and EPS by \($0.25\).
Step by Step Answer: