

An early graphical method for comparing nucleotides sequencesthe so-called diagon plotstill yields one of the best visual
Question:
An early graphical method for comparing nucleotides sequences—the so-called diagon plot—still yields one of the best visual comparisons of sequence relatedness. An example is illustrated in Figure Q9–11, in which the human β-globin gene is compared with the human cDNA for β globin (which contains only the coding portion of the gene; Figure Q9–11A) and with the mouse β-globin gene Figure Q9–11B). Diagon plots are generated by comparing blocks of sequence, in this case blocks of 11 nucleotides at a time. If 9 or more of the nucleotides match, a dot is placed on the diagram at the coordinates corresponding to the blocks being compared. A comparison of all possible blocks generates diagrams such as the ones shown in Figure Q9–11, in which sequence similarities show up as diagonal lines.
Figure Q9–11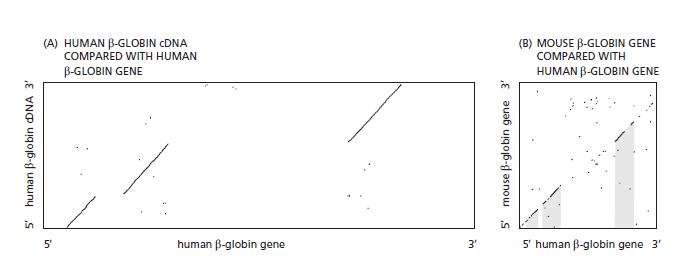
Step by Step Answer:
The diagon plot is a graphical method used to compare nucleotide sequences and visualize sequence re...View the full answer


Essential Cell Biology
ISBN: 9780393680362
5th Edition
Authors: Bruce Alberts, Karen Hopkin, Alexander Johnson, David Morgan, Martin Raff, Keith Roberts, Peter Walter
