

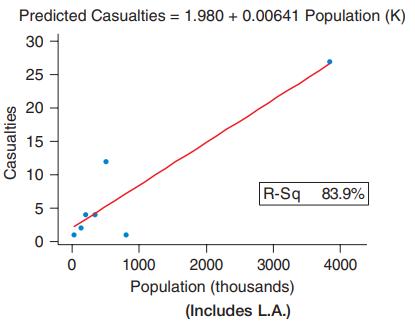
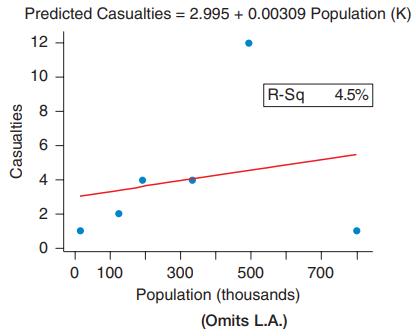
The figures show the number of Iraq casualties through October 2009 and the population of some hometowns
Question:
The figures show the number of Iraq casualties through October 2009 and the population of some hometowns from which the servicemen or servicewomen came, according to the Los Angeles Times. Comment on the difference in graphs and in the coefficient of determination between the top scatterplot that included L.A. and the bottom scatterplot that did not include L.A. L.A. is the point with a population of nearly 4 million.
Fantastic news! We've Found the answer you've been seeking!
Step by Step Answer:
The coefficient of determination is about 84 ...View the full answer

Answered By
OTIENO OBADO
I have a vast experience in teaching, mentoring and tutoring. I handle student concerns diligently and my academic background is undeniably aesthetic
3+ Reviews
10+ Question Solved
Related Book For 

Essential Statistics
ISBN: 9780134134406
2nd Edition
Authors: Robert Gould, Colleen N. Ryan, Rebecca Wong
Question Posted:
