

The figure shows the number of units that students were enrolled in and the number of hours
Question:
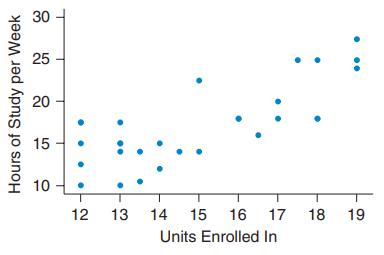
The figure shows the number of units that students were enrolled in and the number of hours (per week) that they reported studying. Do you think there is a positive trend, a negative trend, or no noticeable trend? Explain what this means about the students.
Fantastic news! We've Found the answer you've been seeking!
Step by Step Answer:
There appears to be a positi...View the full answer

Answered By
John Aketch
I am a dedicated person with high degree of professionalism, particularly in academic writing. My desire is to is to make students excel in their academic endeavor.
3+ Reviews
10+ Question Solved
Related Book For 

Essential Statistics
ISBN: 9780134134406
2nd Edition
Authors: Robert Gould, Colleen N. Ryan, Rebecca Wong
Question Posted:
