

Question: 1. For this example, lets use the IQ and GPA (Grade Point Average) data shown in Table 7.2, p. 164, of the textbook. For your
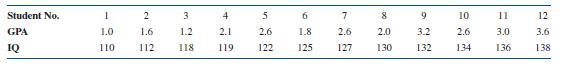
1. For this example, let’s use the IQ and GPA (Grade Point Average) data shown in Table 7.2, p. 164, of the textbook. For your convenience the data is shown again here.
a. Use SPSS to construct a scatter plot of the data. In so doing, name the two variables, IQ and GPA. Plot IQ on the X axis and GPA on the Y axis. Compare your answer with Figure 7.1, p. 161.
b. Assuming a linear relationship exists between IQ and GPA, use SPSS to derive the least squares regression line for predicting GPA given IQ. Compare your answer with that shown in Table 7.2.
Student No. 1 2 3 4 5 6 7 8 9 10 11 12 GPA IQ 1.0 1.6 110 112 12 1.2 2.1 2.6 1.8 2.6 2.0 3.2 2.6 3.0 3.6 118 119 122 125 127 130 132 134 136 138
Step by Step Solution
There are 3 Steps involved in it

Get step-by-step solutions from verified subject matter experts