

Question: Matching: Match each histogram to the boxplot that represents the same data set. Frequency 60 50 40 30 a. 25 20 Frequency b. 150 120
Matching: Match each histogram to the boxplot that represents the same data set.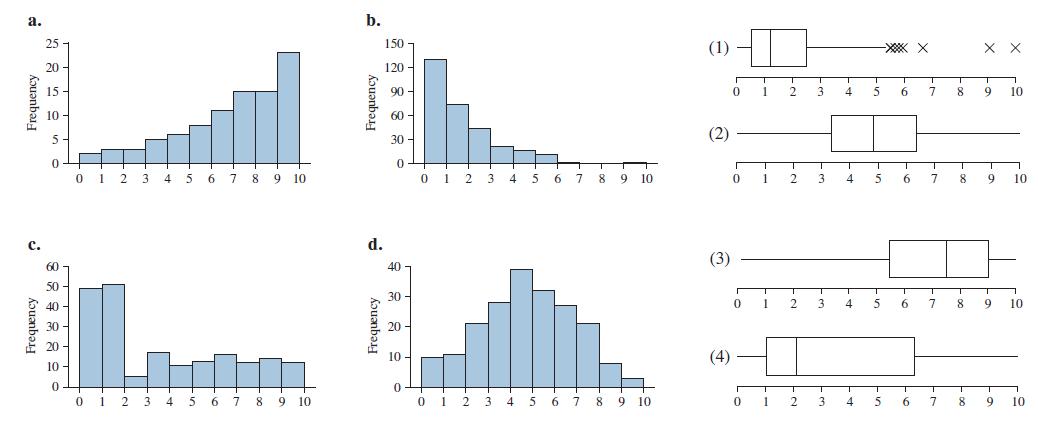
Frequency 60 50 40 30 a. 25 20 Frequency b. 150 120 (1) 15- 10- Frequency 90 T T T T T 0 1 2 3 4 5 6 7 8 9 10 60 5. 30 0 0 T T I I I 0 1 2 3 4 5 6 7 8 9 10 0 1 2 3 4 5 6 7 8 9 10 0 1 2 3 4 5 6 7 8 9 10 Frequency d. 40 30 20 (3) 10 (4) 10 0 0 I . T . I I 0 1 2 3 4 5 6 7 8 9 10 012 3 4 5 6 7 8 9 10 0 1 2 3 4 5 6 7 8 9 10 0 1 2 3 4 5 6 7 8 9 10
Step by Step Solution
There are 3 Steps involved in it
1 Expert Approved Answer
Step: 1 Unlock

Question Has Been Solved by an Expert!
Get step-by-step solutions from verified subject matter experts
Step: 2 Unlock
Step: 3 Unlock