

Question: The table below lists the stopping potential as a function of wavelength in a photoelectric effect experiment. Determine quantities to plot that should yield a
The table below lists the stopping potential as a function of wavelength in a photoelectric effect experiment. Determine quantities to plot that should yield a straight line. Make your plot, establish a best-fit line, and use your line to determine(a) an experimental value for Planck?s constant (b) the work function of the material comprising the photocathode.(c) Use Table 34.1 to identify the material.
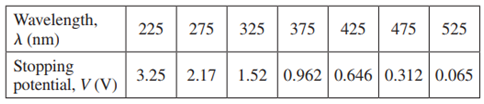
Wavelength, A (nm) 225 275 325 375 425 475 525 Stopping potential, V (V) 3.25 | 2.17 1.52 0.962 0.646 | 0.312 | 0.065
Step by Step Solution
3.27 Rating (159 Votes )
There are 3 Steps involved in it
It looks like the table lists the stopping potential V as a function of the wavelength of the ligh... View full answer

Get step-by-step solutions from verified subject matter experts