

Question: The following five-point summary and boxplot represent the salaries (in $) of 100 employees at a large firm. a. Interpret Q1 and Q3. b. Do
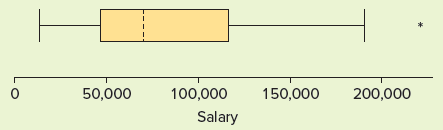
The following five-point summary and boxplot represent the salaries (in $) of 100 employees at a large firm.
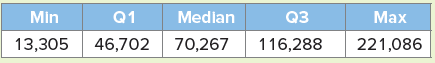
a. Interpret Q1 and Q3.
b. Do outliers exist in the data? Explain.
c. Is the distribution symmetric? If not, comment on its skewness.
Median Min Q1 Max 70,267 221,086 13,305 116,288 46,702 50,000 100,000 150,000 200,000 Salary
Step by Step Solution
★★★★★
3.56 Rating (163 Votes )
There are 3 Steps involved in it
1 Expert Approved Answer
Step: 1 Unlock

a Q1 Approximately 25 percent of the employees earn less than 46702 and approximately 75 of the e... View full answer
Question Has Been Solved by an Expert!
Get step-by-step solutions from verified subject matter experts
Step: 2 Unlock
Step: 3 Unlock