

Question: Data for Unilate Textiles 2008 financial statements are given in Table 2-1 and Table 2-2 in the chapter. a. Compute the 2008 values of the
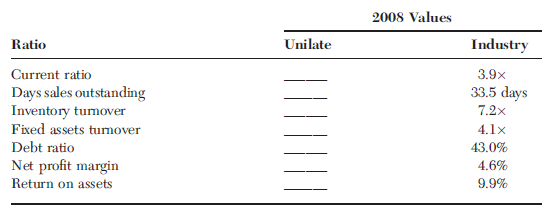
a. Compute the 2008 values of the following ratios:
b. Briefly comment on Unilate€™s 2008 financial position. Can you see any obvious strengths or weaknesses?
c. Compare Unilate€™s 2008 ratios with its 2009 ratios, which are presented in Table 2-6. Comment on whether you believe Unilate€™s financial position improved or deteriorated during 2009.
d. What other information would be useful for projecting whether Unilate€™s financial position is expected to improve or deteriorate in the future?
2008 Values Ratio Industry 3.9x 33.5 days Unilate Current ratio Days sales outstanding Inventory tumover Fixed assets turnover Debt ratio Net profit margin Return on assets 7.2x 4.1x 43.0% 4.6% 9.9%
Step by Step Solution
3.48 Rating (165 Votes )
There are 3 Steps involved in it
a Dollar amounts are in millions b The ratios do not show any particular strengths However Unilate d... View full answer

Get step-by-step solutions from verified subject matter experts
Document Format (2 attachments)
1516_605d88e170c0e_652173.pdf
180 KBs PDF File
1516_605d88e170c0e_652173.docx
120 KBs Word File