

A random sample of 30 second-semester college sophomores was asked to report their GPA (on a four-point
Question:
A random sample of 30 second-semester college sophomores was asked to report their GPA (on a four-point scale) and the average number of hours per week spent on organized extracurricular activities, such as work, sports teams, clubs, committee meetings, and volunteer activities. These data were used to estimate the following equation by least squares: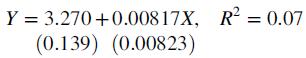
( ): standard error
a. Is the relationship statistically significant at the 5 percent level?
b. Is the relationship substantial?
c. What is the null hypothesis?
d. What does R2 measure and how would you interpret the R2 value here?
e. The average value of the number of hours a week spent on extracurricular activities was 15.15; what was the average GPA?
f. If the statistical relationship were positive, substantial, and high statistically significant, why would we still be cautious about concluding that the way to raise your grades is to spend more time on extracurricular activities?
Step by Step Answer:


Essential Statistics Regression And Econometrics
ISBN: 9780123822215
1st Edition
Authors: Gary Smith
