

Explain why Figure 2.40, a graph of the Dow Jones Industrial Average of stock prices on January
Question:
Explain why Figure 2.40, a graph of the Dow Jones Industrial Average of stock prices on January 27, 1997, gives a misleading visual impression of the volatility of stock prices that day.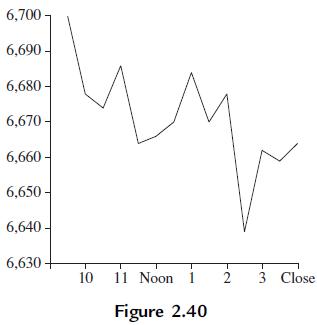
Step by Step Answer:

This question has not been answered yet.
You can Ask your question!
Related Book For 

Essential Statistics Regression And Econometrics
ISBN: 9780123822215
1st Edition
Authors: Gary Smith
Question Posted:
