

What is wrong with the histogram in Figure 2.39 that was constructed from annual rainfall data for
Question:
What is wrong with the histogram in Figure 2.39 that was constructed from annual rainfall data for the years 1901 to 2000? (Density is the rainfall for each year divided by the total rainfall for all 100 years.)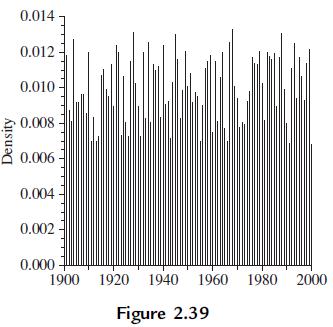
Fantastic news! We've Found the answer you've been seeking!
Step by Step Answer:

Answered By
Aqib Parvej
I am teaching since my graduation time so I have teaching experience of about 5 years and in these years I learn to teach in the best and interesting way .
20+ Reviews
41+ Question Solved
Related Book For 

Essential Statistics Regression And Econometrics
ISBN: 9780123822215
1st Edition
Authors: Gary Smith
Question Posted:
