

Table 10.10 shows hypothetical abilities and test scores. These 20 students have abilities ranging from 75 to
Question:
Table 10.10 shows hypothetical abilities and test scores. These 20 students have abilities ranging from 75 to 95, which we assume to be constant between third and fourth grade. For the four students at each ability level, two score five points above their ability and two score five points below their ability. Whether they score above or below their ability on the fourth grade test is independent of whether they scored above or below their ability on the third grade test. The uniform distribution of abilities and error scores is unrealistic, as are the severely limited values. This stark simplicity is intended to clarify the argument.
a. Estimate the simple linear regression model where third grade score is the dependent variable and ability is the explanatory variable.
b. Estimate the simple linear regression model where ability is the dependent variable and third grade score is the explanatory variable.
c. Explain how the difference between your answers to questions a and b reflect regression to the mean.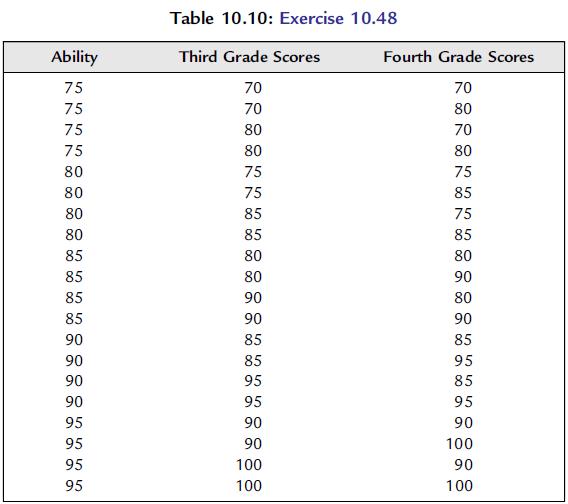
Step by Step Answer:


Essential Statistics Regression And Econometrics
ISBN: 9780123822215
1st Edition
Authors: Gary Smith
