

Table 10.9 shows data on state educational spending per pupil (E), percentage of high school seniors taking
Question:
Table 10.9 shows data on state educational spending per pupil (E), percentage of high school seniors taking the SAT (S), and mean reading SAT score (R).
a. Estimate the equation R = α + βE + ε.
b. Is the estimate of β positive or negative?
c. Is the estimate of β statistically significant at the 1 percent level?
d. Now estimate the equation R = α + β1E + β2S + ε.
e. Is the estimate of β1 positive or negative?
f. Is the estimate of β1 statistically significant at the 1 percent level?
g. Explain any noteworthy differences between your estimates of β in a and β1 in d.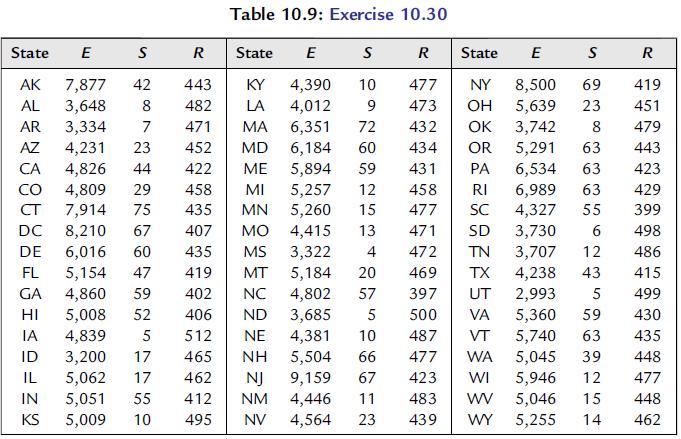
Fantastic news! We've Found the answer you've been seeking!
Step by Step Answer:

Answered By
John Kimutai
I seek to use my competencies gained through on the job experience and skills learned in training to carry out tasks to the satisfaction of users. I have a keen interest in always delivering excellent work
11+ Reviews
24+ Question Solved
Related Book For 

Essential Statistics Regression And Econometrics
ISBN: 9780123822215
1st Edition
Authors: Gary Smith
Question Posted:
