

Table 8.11 shows the age and bone density of 25 women between the ages of 15 and
Question:
Table 8.11 shows the age and bone density of 25 women between the ages of 15 and 45 who died between 1729 and 1852 [12]. For a sample of modern-day British women of similar ages, the relationship between bone density and age is statistically significant at the 1 percent level, with an estimated slope of −0.658. Draw a scatter diagram and estimate the model Y = α + βX + ε by least squares.
a. Which variable did you use as the dependent variable? Explain your reasoning.
b. Is the estimated slope statistically significant at the 1 percent level?
c. Compare your results to those reported for modern-day British women.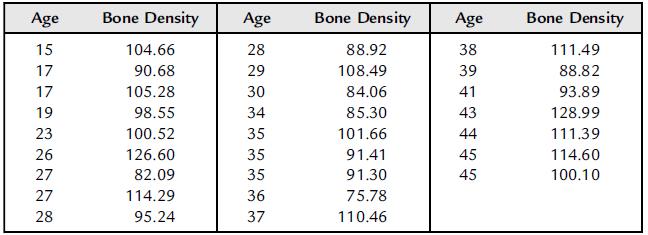
Step by Step Answer:

This question has not been answered yet.
You can Ask your question!
Related Book For 

Essential Statistics Regression And Econometrics
ISBN: 9780123822215
1st Edition
Authors: Gary Smith
Question Posted:
