

Table 8.9 shows the systolic and diastolic blood pressure readings (both in mmHG) for 26 healthy young
Question:
Table 8.9 shows the systolic and diastolic blood pressure readings (both in mmHG)
for 26 healthy young adults [10]. Ignoring gender, use all 26 observations to estimate a linear regression model with systolic blood pressure as the dependent variable and diastolic blood pressure as the explanatory variable.
a. Is the estimated relationship statistically significant at the 5 percent level?
b. What is the correlation between systolic and diastolic blood pressure?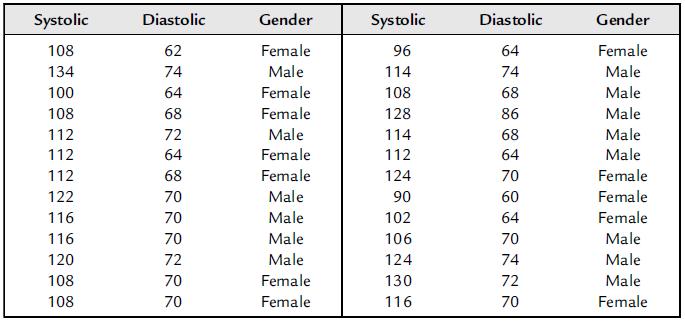
Fantastic news! We've Found the answer you've been seeking!
Step by Step Answer:

Answered By
Ali Khawaja
my expertise are as follows: financial accounting : - journal entries - financial statements including balance sheet, profit & loss account, cash flow statement & statement of changes in equity -consolidated statement of financial position. -ratio analysis -depreciation methods -accounting concepts -understanding and application of all international financial reporting standards (ifrs) -international accounting standards (ias) -etc business analysis : -business strategy -strategic choices -business processes -e-business -e-marketing -project management -finance -hrm financial management : -project appraisal -capital budgeting -net present value (npv) -internal rate of return (irr) -net present value(npv) -payback period -strategic position -strategic choices -information technology -project management -finance -human resource management auditing: -internal audit -external audit -substantive procedures -analytic procedures -designing and assessment of internal controls -developing the flow charts & data flow diagrams -audit reports -engagement letter -materiality economics: -micro -macro -game theory -econometric -mathematical application in economics -empirical macroeconomics -international trade -international political economy -monetary theory and policy -public economics ,business law, and all regarding commerce
1+ Reviews
10+ Question Solved
Related Book For 

Essential Statistics Regression And Econometrics
ISBN: 9780123822215
1st Edition
Authors: Gary Smith
Question Posted:
