

Table 9.11 shows annual U.S. beer production (X), in millions of barrels, and the number of married
Question:
Table 9.11 shows annual U.S. beer production (X), in millions of barrels, and the number of married people (Y), in millions. Draw a scatter diagram and estimate the equation Y = α + βX + ε by least squares to see if there is a statistically significant relationship at the 5 percent level. If so, do you think that beer drinking leads to marriage, marriage leads to drinking, or what?
Table 9.11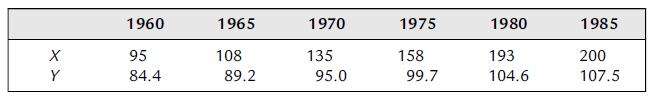
Step by Step Answer:

This question has not been answered yet.
You can Ask your question!
Related Book For 

Essential Statistics Regression And Econometrics
ISBN: 9780123822215
1st Edition
Authors: Gary Smith
Question Posted:
