Use the data in Table 1.4 to make a histogram of the U.S. dollar prices of a
Question:
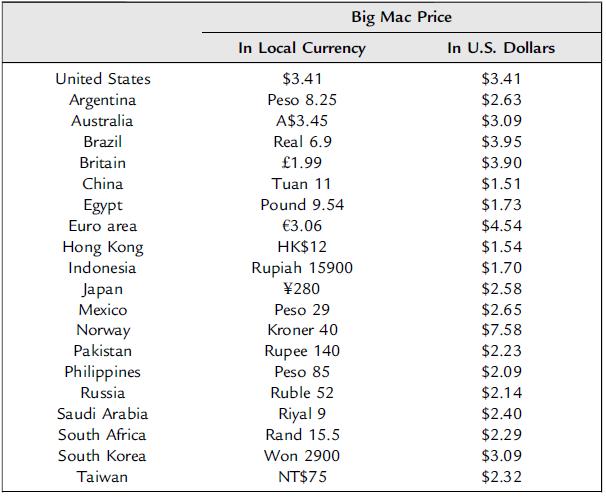
Use the data in Table 1.4 to make a histogram of the U.S. dollar prices of a Big Mac in these 20 countries. Use these intervals for the prices: 1–3, 3–4, 4–5, 5–8.
Transcribed Image Text:
United States Argentina Australia Big Mac Price In Local Currency $3.41 In U.S. Dollars $3.41 Peso 8.25 $2.63 A$3.45 $3.09 Brazil Real 6.9 $3.95 Britain 1.99 $3.90 China Tuan 11 $1.51 Egypt Pound 9.54 $1.73 Euro area 3.06 $4.54 Hong Kong Indonesia HK$12 $1.54 Rupiah 15900 $1.70 Japan Mexico 280 $2.58 Peso 29 $2.65 Norway Kroner 40 $7.58 Pakistan Philippines Russia Rupee 140 $2.23 Peso 85 $2.09 Ruble 52 $2.14 Saudi Arabia Riyal 9 $2.40 South Africa Rand 15.5 $2.29 South Korea Won 2900 $3.09 Taiwan NT$75 $2.32
Fantastic news! We've Found the answer you've been seeking!
Step by Step Answer:
Answer rating: 0% (1 review)

Answered By

Ashington Waweru
I am a lecturer, research writer and also a qualified financial analyst and accountant. I am qualified and articulate in many disciplines including English, Accounting, Finance, Quantitative spreadsheet analysis, Economics, and Statistics. I am an expert with sixteen years of experience in online industry-related work. I have a master's in business administration and a bachelor’s degree in education, accounting, and economics options.
I am a writer and proofreading expert with sixteen years of experience in online writing, proofreading, and text editing. I have vast knowledge and experience in writing techniques and styles such as APA, ASA, MLA, Chicago, Turabian, IEEE, and many others.
I am also an online blogger and research writer with sixteen years of writing and proofreading articles and reports. I have written many scripts and articles for blogs, and I also specialize in search engine
I have sixteen years of experience in Excel data entry, Excel data analysis, R-studio quantitative analysis, SPSS quantitative analysis, research writing, and proofreading articles and reports. I will deliver the highest quality online and offline Excel, R, SPSS, and other spreadsheet solutions within your operational deadlines. I have also compiled many original Excel quantitative and text spreadsheets which solve client’s problems in my research writing career.
I have extensive enterprise resource planning accounting, financial modeling, financial reporting, and company analysis: customer relationship management, enterprise resource planning, financial accounting projects, and corporate finance.
I am articulate in psychology, engineering, nursing, counseling, project management, accounting, finance, quantitative spreadsheet analysis, statistical and economic analysis, among many other industry fields and academic disciplines. I work to solve problems and provide accurate and credible solutions and research reports in all industries in the global economy.
I have taught and conducted masters and Ph.D. thesis research for specialists in Quantitative finance, Financial Accounting, Actuarial science, Macroeconomics, Microeconomics, Risk Management, Managerial Economics, Engineering Economics, Financial economics, Taxation and many other disciplines including water engineering, psychology, e-commerce, mechanical engineering, leadership and many others.
I have developed many courses on online websites like Teachable and Thinkific. I also developed an accounting reporting automation software project for Utafiti sacco located at ILRI Uthiru Kenya when I was working there in year 2001.
I am a mature, self-motivated worker who delivers high-quality, on-time reports which solve client’s problems accurately.
I have written many academic and professional industry research papers and tutored many clients from college to university undergraduate, master's and Ph.D. students, and corporate professionals. I anticipate your hiring me.
I know I will deliver the highest quality work you will find anywhere to award me your project work. Please note that I am looking for a long-term work relationship with you. I look forward to you delivering the best service to you.
3.00+
2+ Reviews
10+ Question Solved
Related Book For 

Essential Statistics Regression And Econometrics
ISBN: 9780123822215
1st Edition
Authors: Gary Smith
Question Posted:
Students also viewed these Business questions
-
There are two components for this Portfolio Project a career management portfolio which is to be developed but not submitted and an annotated career management portfolio table of contents which will...
-
Use the data in Table 1.4 for the 19 countries other than the United States to make a histogram of the U.S. dollar prices of a Big Mac. Use these intervals for the prices: 1.412.41, 2.413.41,...
-
An important part of the customer service responsibilities of a cable company relates to the speed with which trouble in service can be repaired. Historically, the data show that the likelihood is...
-
Distinguish between a calorie and a Calorie.
-
The following data were obtained for the absorption by a dye dissolved in methylbenzene using a 2.50 mm cell. Calculate the molar absorption coefficient of the dye at the wavelength employed:...
-
One critical-thinking skill is a heightened awareness of the danger of reaching a conclusion prior to acquiring missing information that were it known would have a reasonable probability of altering...
-
Sharp Company manufactures a product for which the following standards have been set: During March, the company purchased direct materials at a cost of $55,650, all of which were used in the...
-
Costs transferred in from Department A to Department B Blank______. Multiple choice question. will not be complete with respect to work done in Department A must be at least 50% complete will always...
-
Use these household taxable income data (in thousands of dollars) to make a histogram, using intervals equal to the federal income tax brackets shown in Table 2.5: 10, 20, 30, 40, 50, 60, 70, 80, 90,...
-
Use the data in Table 1.4 to make a histogram of the U.S. dollar prices of a Big Mac in these 20 countries. Use these intervals for the prices: 12, 23, 34, 45, 58. United States Argentina Australia...
-
Compute the mean, median, midrange, and mode for each of the importance factors in the Excel file Coffee Shop Preferences using the appropriate Excel functions.
-
Tom Jones has recently been employed as trainee Accountant of Michael Enterprise Company Limited and currently the financial statement are be prepared for the year-ended 30 September 2021. The...
-
The following information pertains to ALL Questions in the Quiz. A series RC load with R = 10 ohms and C = 2.75 pF is to be matched to a 50 ohm transmission line at a frequency of 5.8 GHz. What is...
-
Why you want to create leadership-development plan?
-
Read the newsletter Savings Made Simple. Complete the activities in the newsletter. These activities will not be submitted for grading. http://www.ogburn.org/PFLesson02.pdf Lesson 2: Savings Made...
-
3. Andrew Co. has $100,000 of pre-tax GAAP book income for the current period that includes a goodwill impairment charge of $23,000 for a write-down associated with the previous acquisition of Hux...
-
Determine the directions of the principal axes with origin located at point O, and the principal moments of inertia for the area about these axes. Given: a = 4 in b = 2 in c = 2 in d = 2 in r = 1 in a
-
Write a paper about the Working relationship in the organization- collaboration within and outside the organization
-
Milan Company had the following activity for the year ended December 31. Required: Prepare an income statement for year ended December 31. Sales revenue $5,000,000 $ 825,000 Selling expenses $...
-
Kimmel Company expects to incur $800,000 in manufacturing overhead costs this year. During the year, it expects to use 10,000 direct labor hours at a cost of $200,000 and 4,000 machine hours....
-
Access Products, Inc., incurred the following actual overhead costs for the month of November. Overhead is applied based on a predetermined rate of $24 per machine hour, and 5,100 machine hours were...
-
This abuse could include insufficient funds to meet requirements. is this is finacial abuse
-
A property owner has a property with a forecast net operating income of $100,000 for next year. A lender has indicated that he would make a loan on the property based on a 1.25 debt service coverage...
-
Through history, various economies have treated the use of interest as an unethical behavior. If explicitly charging interest were made illegal in the US, what are at least three (legal) mechanisms...

Study smarter with the SolutionInn App


