

Use these household taxable income data (in thousands of dollars) to make a histogram, using intervals equal
Question:
Use these household taxable income data (in thousands of dollars) to make a histogram, using intervals equal to the federal income tax brackets shown in Table 2.5: 10, 15, 20, 20, 30, 35, 40, 40, 50, 55, 60, 60, 70, 75, 80, 80, 90, 95, 100, 100.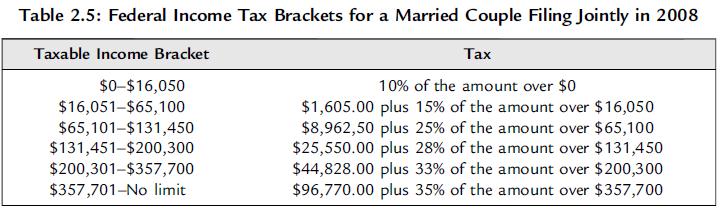
Fantastic news! We've Found the answer you've been seeking!
Step by Step Answer:

Answered By
David Muchemi
I am a professional academic writer with considerable experience in writing business and economic related papers. I have been writing for my clients who reach out to me personally after being recommended to me by satisfied clients.
I have the English language prowess, no grammatical and spelling errors can be found in my work. I double-check for such mistakes before submitting my papers.
I deliver finished work within the stipulated time and without fail. I am a good researcher on any topic especially those perceived to be tough.
I am ready to work on your papers and ensure you receive the highest quality you are looking for. Please hire me to offer my readily available quality service.
Best regards,
27+ Reviews
61+ Question Solved
Related Book For 

Essential Statistics Regression And Econometrics
ISBN: 9780123822215
1st Edition
Authors: Gary Smith
Question Posted:
