

Figure 17-10 shows the actual budget deficit and the cyclically adjusted budget deficit as a percentage of
Question:
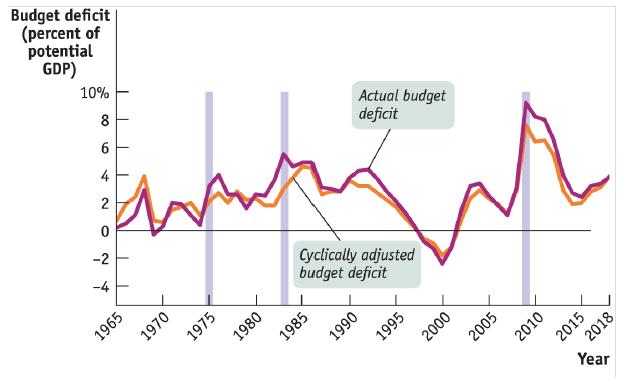
Figure 17-10 shows the actual budget deficit and the cyclically adjusted budget deficit as a percentage of GDP in the United States from 1965 to 2018. Assuming that potential output was unchanged, use this figure to determine which of the years from 1990 to 2018 the government used expansionary fiscal policy and in which years it used contractionary fiscal policy.
Data From Figure 17-10:-
Fantastic news! We've Found the answer you've been seeking!
Step by Step Answer:

Answered By
PALASH JHANWAR
I am a Chartered Accountant with AIR 45 in CA - IPCC. I am a Merit Holder ( B.Com ). The following is my educational details.
PLEASE ACCESS MY RESUME FROM THE FOLLOWING LINK: https://drive.google.com/file/d/1hYR1uch-ff6MRC_cDB07K6VqY9kQ3SFL/view?usp=sharing
3+ Reviews
10+ Question Solved
Related Book For 

Question Posted:
