

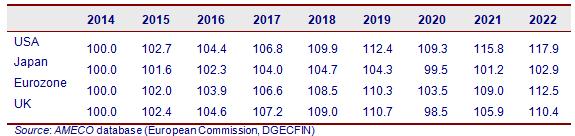
The table shows index numbers for real GDP (national output) for various countries (2014 100). Using the
Question:
The table shows index numbers for real GDP (national output) for various countries (2014 100). Using the formula G = (Yt – Yt–1)/Yt–1 100 (where G is the rate of growth, Y is the index number of output, t is any given year and t–1 is the previous year):
(a) Work out the growth rate, G, for each country for each year from 2015 to 2022.
(b) Plot the figures on a graph. Describe the pattern that emerges.
Fantastic news! We've Found the answer you've been seeking!
Step by Step Answer:
a See the following table Growth Rates of Selected ...View the full answer

Answered By
Nazrin Ziad
I am a post graduate in Zoology with specialization in Entomology.I also have a Bachelor degree in Education.I posess more than 10 years of teaching as well as tutoring experience.I have done a project on histopathological analysis on alcohol treated liver of Albino Mice.
I can deal with every field under Biology from basic to advanced level.I can also guide you for your project works related to biological subjects other than tutoring.You can also seek my help for cracking competitive exams with biology as one of the subjects.
2+ Reviews
10+ Question Solved
Related Book For 

Essential Economics For Business
ISBN: 9781292728940
7th Edition
Authors: John Sloman, Elizabeth Jones
Question Posted:
