

Question: Exercise 13.8 gave data on x = treadmill run time to exhaustion and y = 20-km ski time. The x values and corresponding standardized residuals
Exercise 13.8 gave data on x = treadmill run time to exhaustion and y = 20-km ski time. The x values and corresponding standardized residuals from a simple linear regression are as follows.
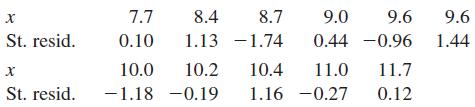
Construct a standardized residual plot. Does the plot exhibit any unusual features?
Data from Exercises 13.8
The accompanying data on x = treadmill run time to exhaustion (min) and y = 20-km ski time (min) were taken from the article “Physiological Characteristics and Performance of Top U.S. Biathletes” (Medicine and Science in Sports and Exercise [1995]: 1302–1310):
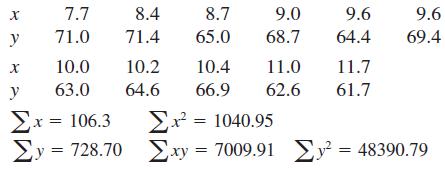
a. Does a scatterplot suggest that the simple linear regression model is appropriate?
b. Determine the equation of the estimated regression line, and draw the line on your scatterplot.
c. What is your estimate of the average change in ski time associated with a 1-min increase in treadmill time?
d. What would you predict ski time to be for an individual whose treadmill time is 10 min?
e. Should the model be used as a basis for predicting ski time when treadmill time is 15 min? Explain.
f. Calculate and interpret the value of r2.
g. Calculate and interpret the value of se.
St. resid. X St. resid. 8.7 9.0 9.6 9.6 1.13 -1.74 0.44 -0.96 1.44 7.7 8.4 0.10 10.0 10.2 10.4 11.0 -1.18 -0.19 1.16 -0.27 11.7 0.12
Step by Step Solution
3.45 Rating (158 Votes )
There are 3 Steps involved in it
To address the problem well handle it stepbystep a Scatterplot and Linear Regression Model Appropriateness Scatterplot Create a scatterplot of the dat... View full answer

Get step-by-step solutions from verified subject matter experts