

The accompanying data on x = treadmill run time to exhaustion (min) and y = 20-km ski
Question:
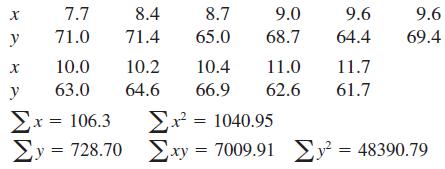
The accompanying data on x = treadmill run time to exhaustion (min) and y = 20-km ski time (min) were taken from the article “Physiological Characteristics and Performance of Top U.S. Biathletes” (Medicine and Science in Sports and Exercise [1995]: 1302–1310):
a. Does a scatterplot suggest that the simple linear regression model is appropriate?
b. Determine the equation of the estimated regression line, and draw the line on your scatterplot.
c. What is your estimate of the average change in ski time associated with a 1-min increase in treadmill time?
d. What would you predict ski time to be for an individual whose treadmill time is 10 min?
e. Should the model be used as a basis for predicting ski time when treadmill time is 15 min? Explain.
f. Calculate and interpret the value of r2.
g. Calculate and interpret the value of se.
Step by Step Answer:
To address the questions well perform simple linear regression analysis based on the given data Scatterplot A scatterplot is a graphical representation of the data points in the form of dots on a grap...View the full answer


Introduction To Statistics And Data Analysis
ISBN: 9780495118732
3rd Edition
Authors: Roxy Peck, Chris Olsen, Jay L. Devore
