

The Muller-Lyer illusion is shown in the figure. Although the two horizontal lines are the same length,
Question:
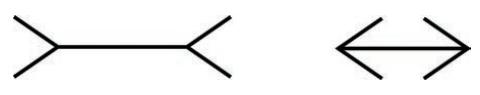
The Muller-Lyer illusion is shown in the figure. Although the two horizontal lines are the same length, the line on the left appears to be much longer. To examine the strength of this illusion, Gillam and Chambers (1985) recruited 10 participants who reproduced the length of the horizontal line in the left panel of the figure. The strength of the illusion was measured by how much longer the reproduced line was than the actual length of the line in the figure. Below are data like those observed by the researchers. Each value represents how much longer (in millimeters) the reproduced line was than the line in the figure.
2.08 2.7 3.42 1.59 2.04 2.87 3.36 0.49 3.82 3.91
a. Use a one-tailed hypothesis test with α = .01 to demonstrate that the individuals in the sample significantly overestimate the true length of the line. (Note: Accurate estimation would produce a mean of μ = 0 millimeters.)
b. Calculate the estimated d and r2 , the percentage of variance accounted for, to measure the size of this effect.
c. Construct a 95% confidence interval for the population mean estimated length of the vertical line.
Step by Step Answer:
a Step 1 H 0 drawn 0 H 1 drawn 0 and 01 onetailed S...View the full answer


Essentials Of Statistics For The Behavioral Sciences
ISBN: 9780357365298
10th Edition
Authors: Frederick J Gravetter, Larry B. Wallnau, Lori Ann B. Forzano, James E. Witnauer
