

Water quality ratings of 36 Southern California beaches were given in the article How Safe Is the
Question:
Water quality ratings of 36 Southern California beaches were given in the article “How Safe Is the Surf?” (Los Angeles Times, October 26, 2002). The ratings, which ranged from A to F and which reflect the risk of getting sick from swimming at a particular beach, are given in the following list:
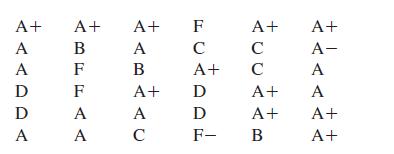
a. Summarize the given ratings by constructing a relative frequency distribution and a bar chart. Comment on the interesting features of your bar chart.
b. Would it be appropriate to construct a dotplot for these data? Why or why not?
Fantastic news! We've Found the answer you've been seeking!
Step by Step Answer:
a To construct a relative frequency distribution we count the occurrences of each rating and divide ...View the full answer

Answered By
Churchil Mino
I have been a tutor for 2 years and have experience working with students of all ages and abilities. I am comfortable working with students one-on-one or in small groups, and am able to adapt my teaching style to meet the needs of each individual. I am patient and supportive, and my goal is to help my students succeed.
I have a strong background in math and science, and have tutored students in these subjects at all levels, from elementary school to college. I have also helped students prepare for standardized tests such as the SAT and ACT. In addition to academic tutoring, I have also worked as a swim coach and a camp counselor, and have experience working with children with special needs.
0 Reviews
10+ Question Solved
Related Book For 

Introduction To Statistics And Data Analysis
ISBN: 9780495118732
3rd Edition
Authors: Roxy Peck, Chris Olsen, Jay L. Devore
Question Posted:
