

Question: Flight Numbers Data Set 15 in Appendix B lists flight numbers of 48 different flights, and the average (mean) of those flight numbers is 11.0.
Flight Numbers Data Set 15 in Appendix B lists flight numbers of 48 different flights, and the average (mean) of those flight numbers is 11.0.
Identify the level of measurement of the data. Also, explain what is wrong with the given calculation.
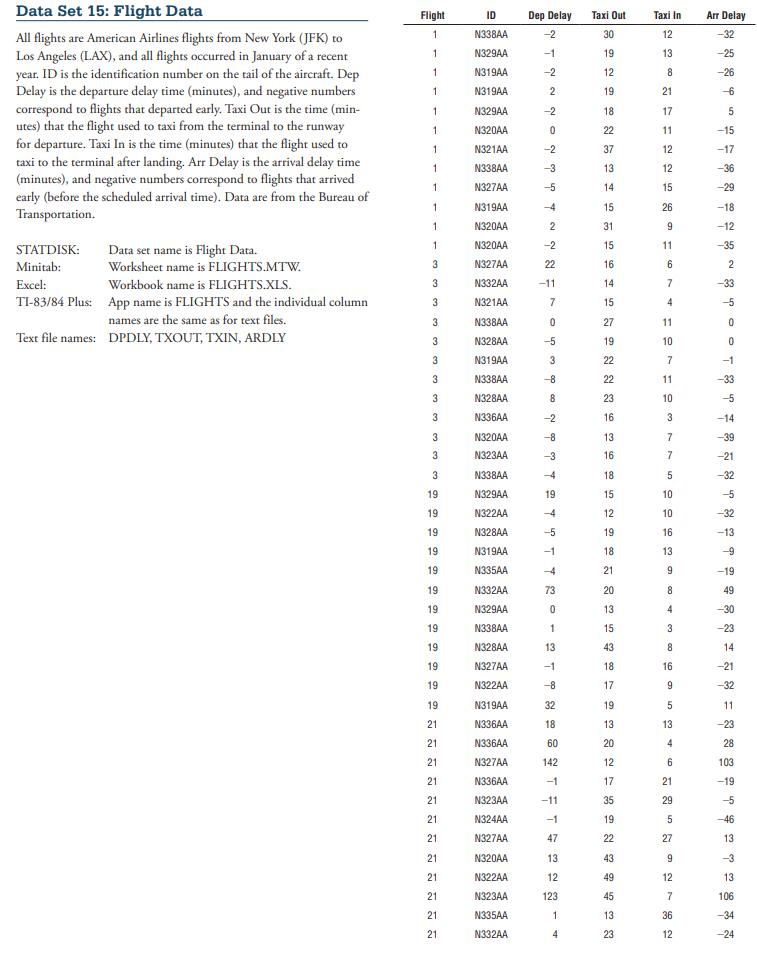
Data set name is Flight Data. Data Set 15: Flight Data All flights are American Airlines flights from New York (JFK) to Los Angeles (LAX), and all flights occurred in January of a recent year. ID is the identification number on the tail of the aircraft. Dep Delay is the departure delay time (minutes), and negative numbers correspond to flights that departed early. Taxi Out is the time (min- utes) that the flight used to taxi from the terminal to the runway for departure. Taxi In is the time (minutes) that the flight used to taxi to the terminal after landing. Arr Delay is the arrival delay time (minutes), and negative numbers correspond to flights that arrived early (before the scheduled arrival time). Data are from the Bureau of Transportation. STATDISK: Flight ID Dep Delay Taxi Out Taxi In Arr Delay 1 N338AA -2 30 12 -32 1 N329AA -1 19 13 -25 1 N319AA -2 12 8 -26 1 N319AA 2 19 21 -6 1 N329AA -2 18 17 5 1 N320AA 0 22 11 -15 1 N321AA -2 37 12 -17 1 N338AA -3 13 12 -36 1 N327AA -5 14 15 -29 1 N319AA -4 15 26 -18 1 N320AA 2 31 9 -12 1 N320AA -2 15 11 -35 Minitab: Worksheet name is FLIGHTS.MTW. 3 N327AA 22 16 6 2 Excel: Workbook name is FLIGHTS.XLS. 3 N332AA -11 14 7 -33 TI-83/84 Plus: App name is FLIGHTS and the individual column names are the same as for text files. 3 N321AA 7 15. 4 -5 3 N338AA 0 27 11 0 Text file names: DPDLY, TXOUT, TXIN, ARDLY 3 N328AA -5 19 10 0 3 N319AA 3 22 7 -1 3 N338AA -8 22 11 -33 3 N328AA 8 23 10 -5 3 N336AA -2 16. 3 -14 3 N320AA -8 13 7 -39 3 N323AA -3 16 7 -21 3 N338AA -4 18 5 -32 19 N329AA 19 15 10 -5 19 N322AA -4 12 10 -32 19 N328AA 19 16 -13 19 N319AA -1 18 13 -9 19 N335AA -4 21 9 -19 19 N332AA 73 20 8 49 19 N329AA 0 13 4 -30 19 N338AA 1 15 3 -23 19 N328AA 13 43 8 14 19 N327AA -1 18 16 -21 19 N322AA -8 17 9 -32 19 N319AA 32 19 5 11 21 N336AA 13 13 -23 21 N336AA 60 20 4 21 N327AA 142 12 6 103 21. N336AA -1 21 N323AA -11 21 N324AA -1 21 N327AA 21 N320AA 21. N322AA 21 N323AA 123 21 N335AA 21 N332AA TFT-4 17 21 -19 35 29 19 5 -46 47 22 27 13 43 9 12 49 12 45 7 106 1 13 36 -34 23 12 -24 g
Step by Step Solution
3.47 Rating (157 Votes )
There are 3 Steps involved in it

Get step-by-step solutions from verified subject matter experts