

Question: Answer a question 16. Flight Delays Data Set 15 in Appendix B lists 48 different departure delay times (minutes) for American Airlines flights from New
Answer a question
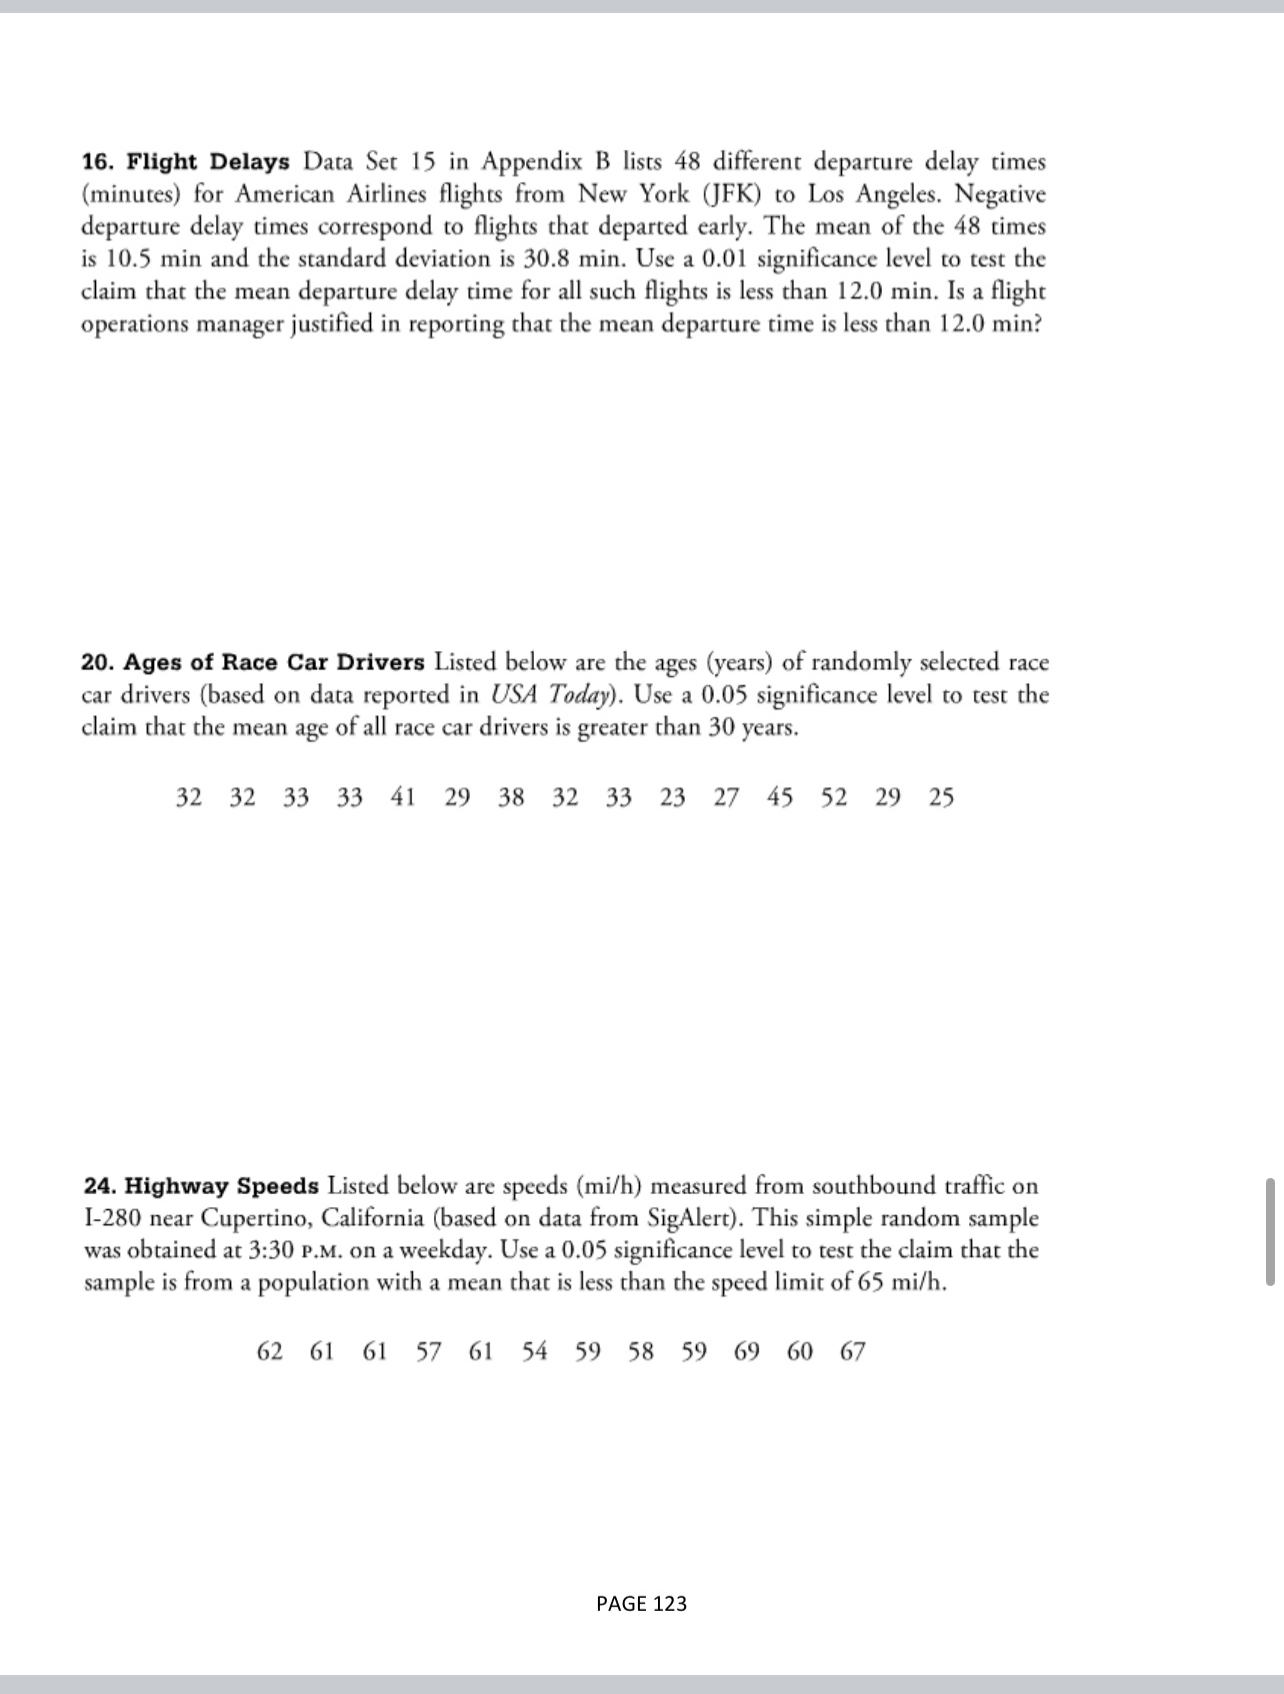
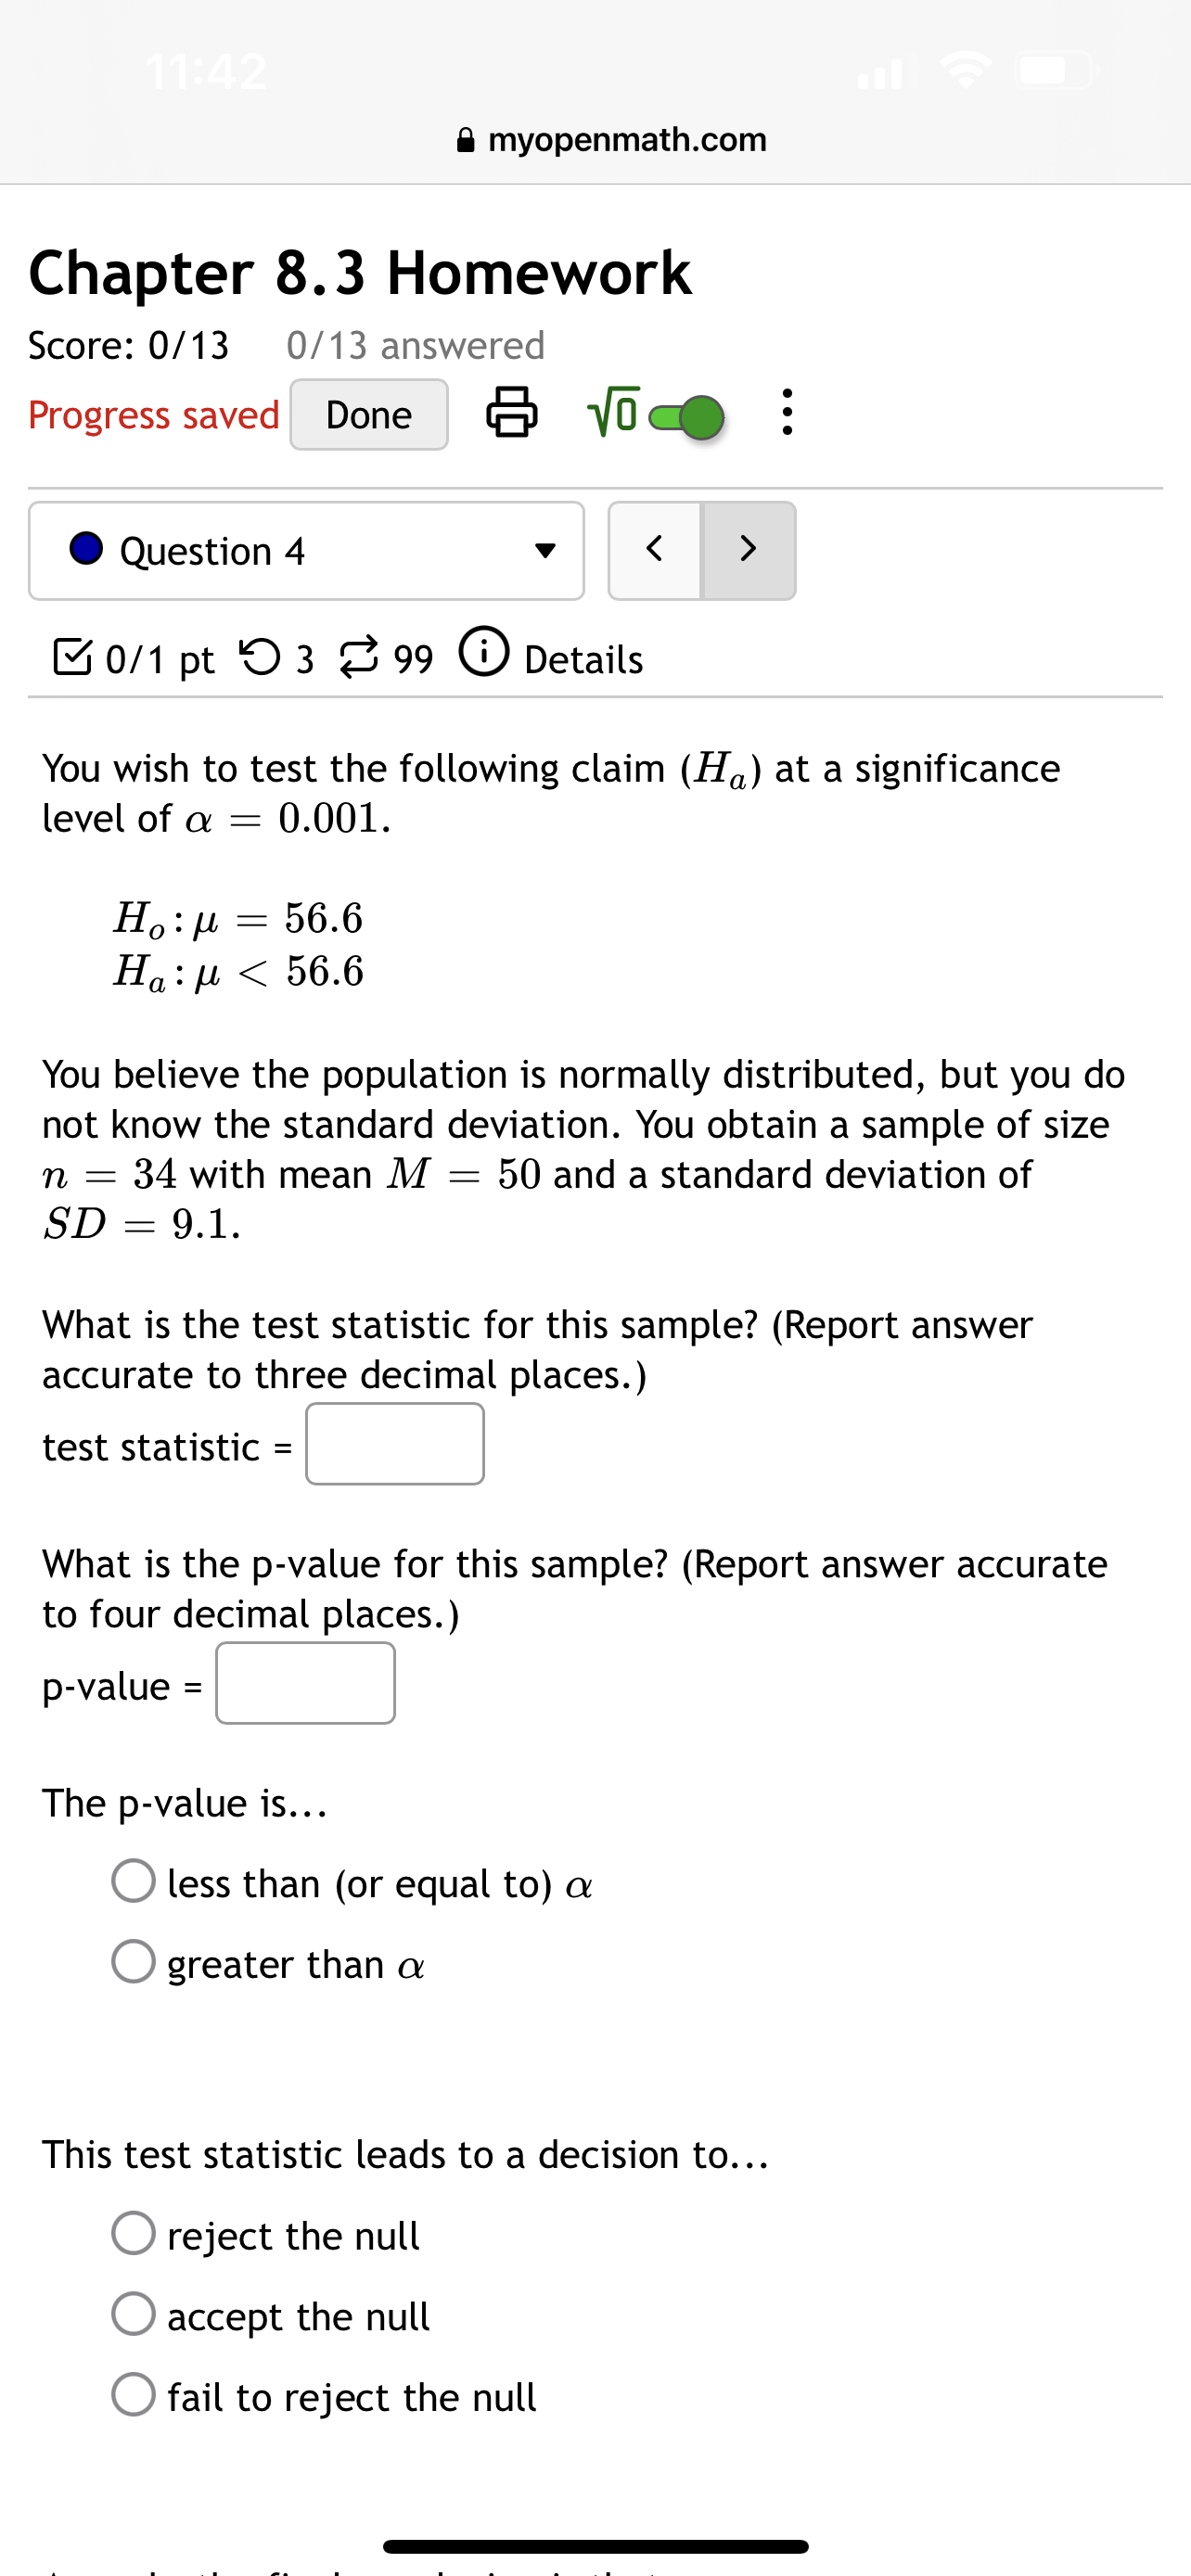
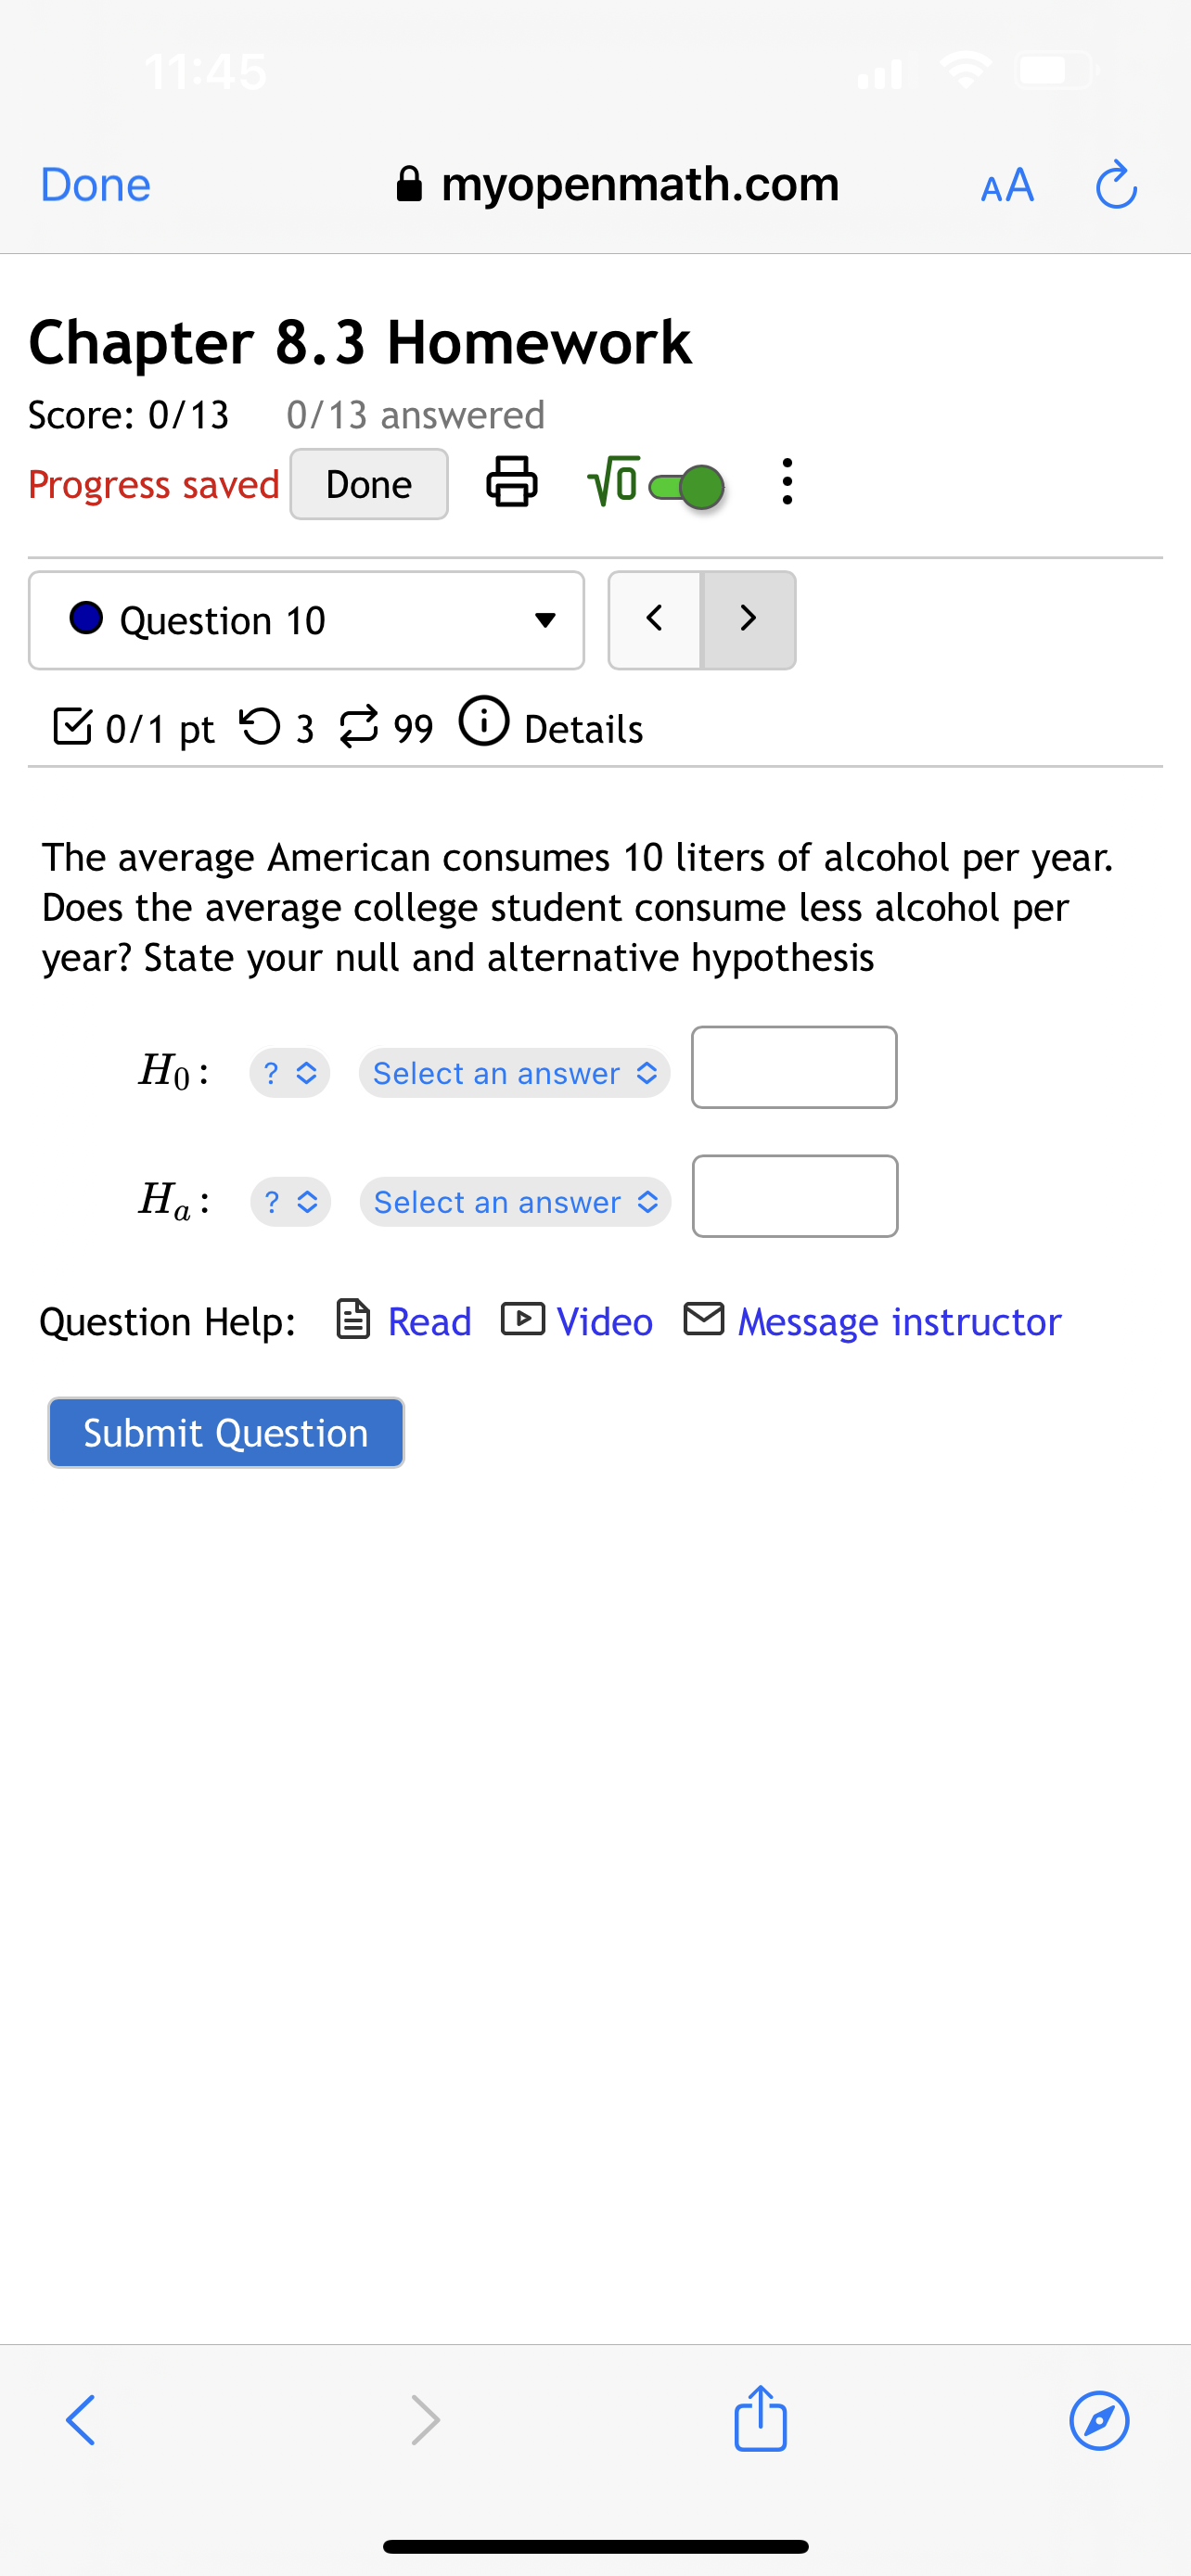
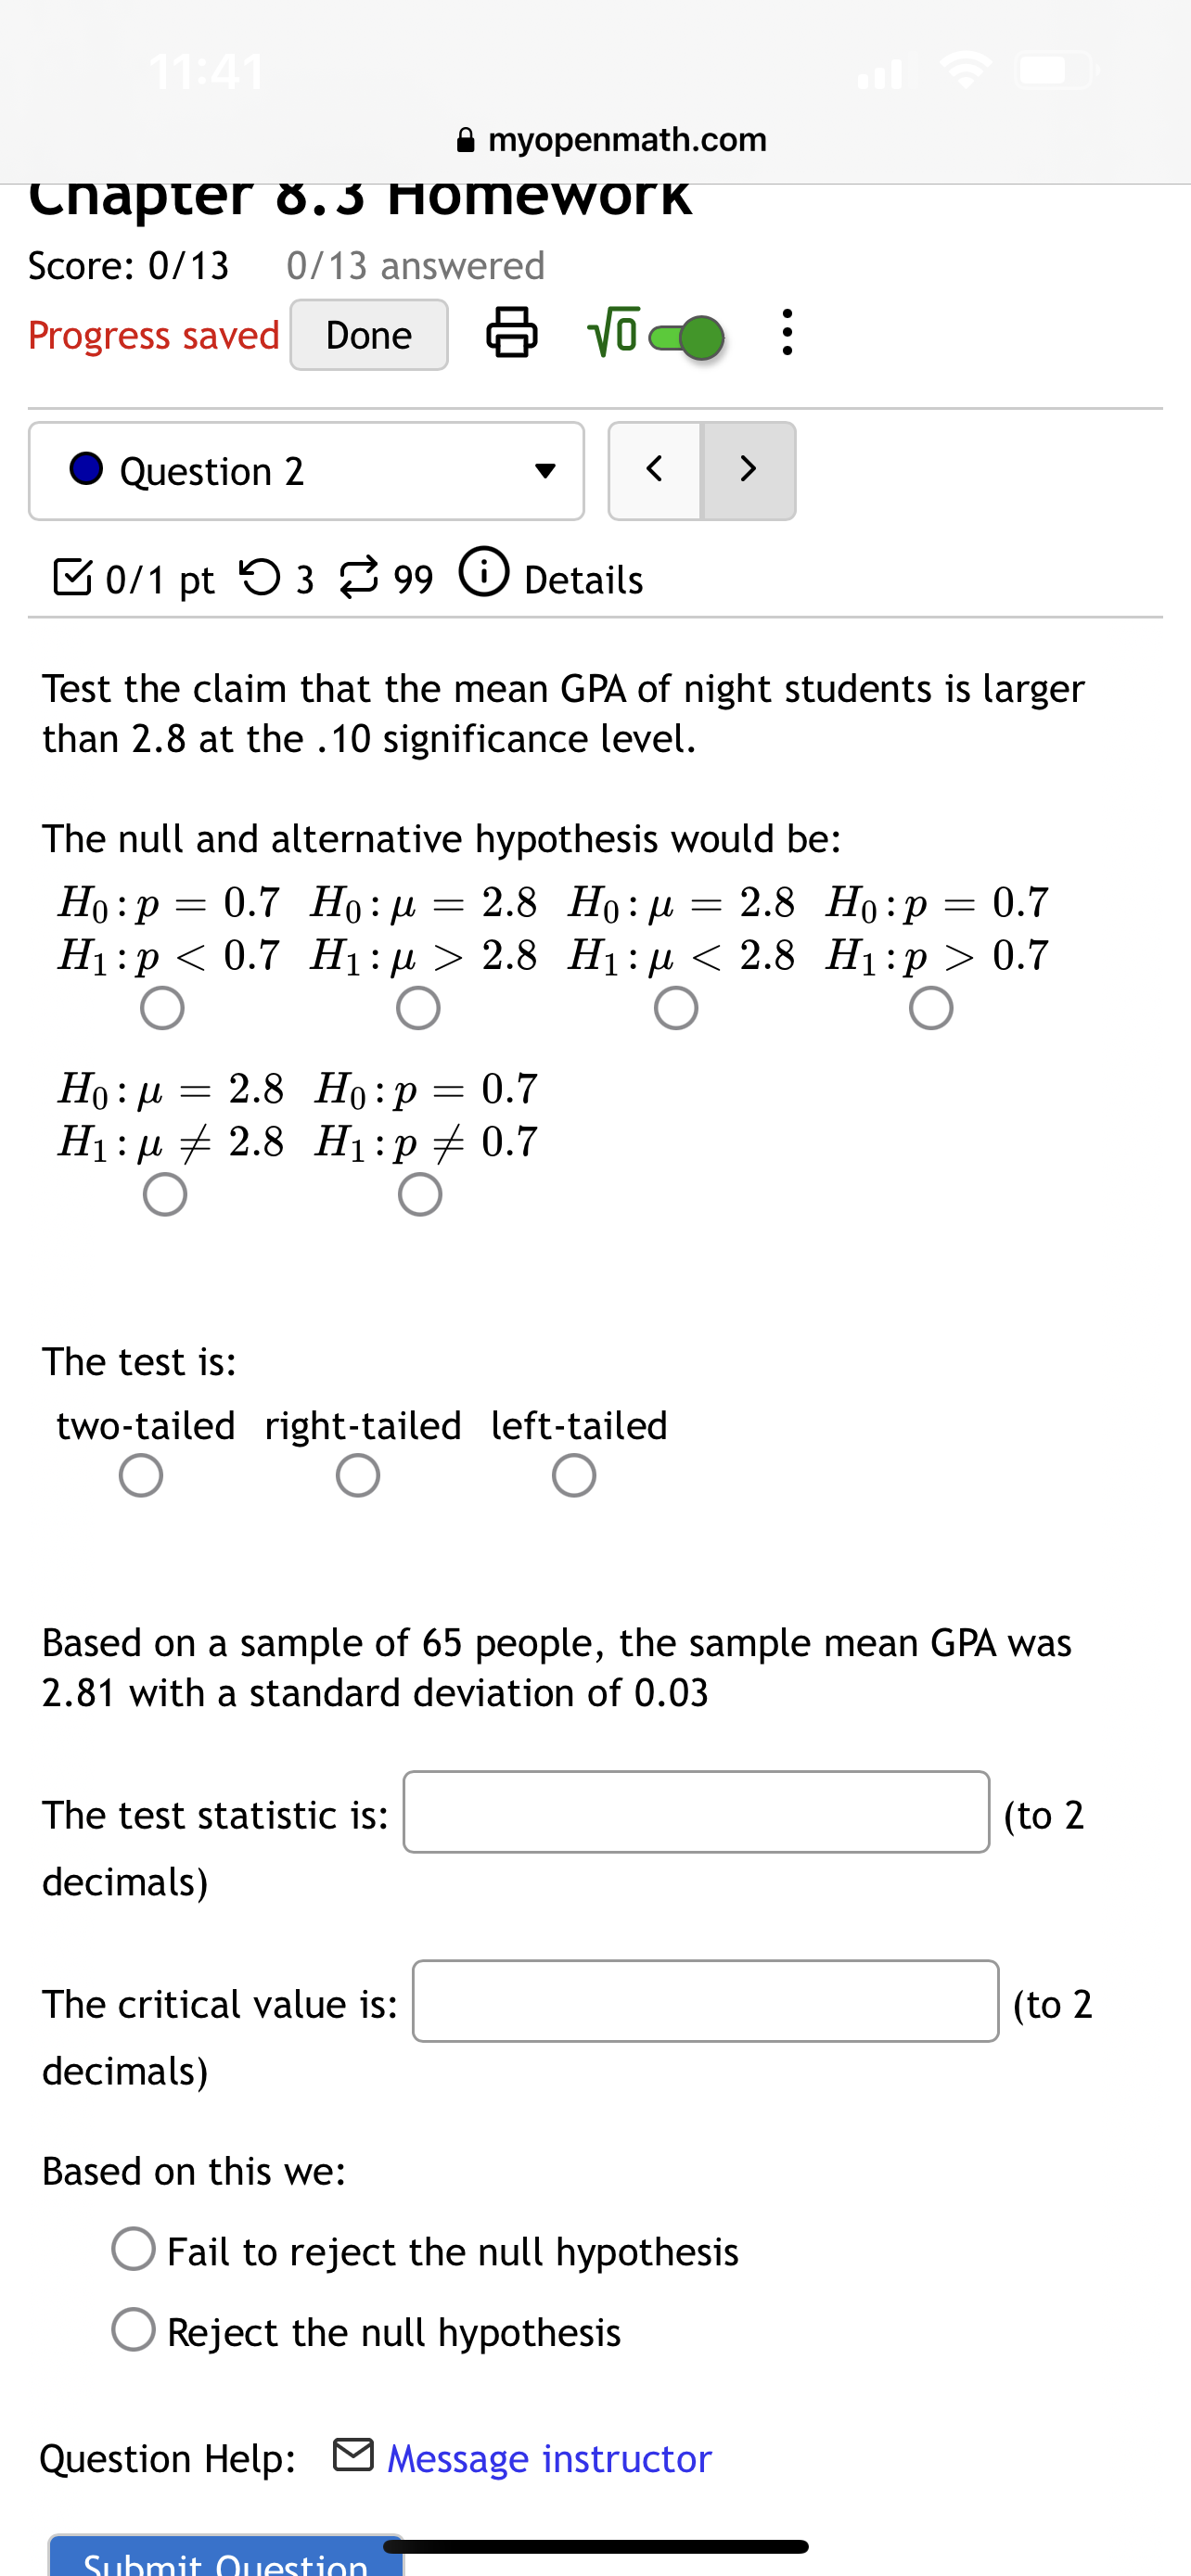
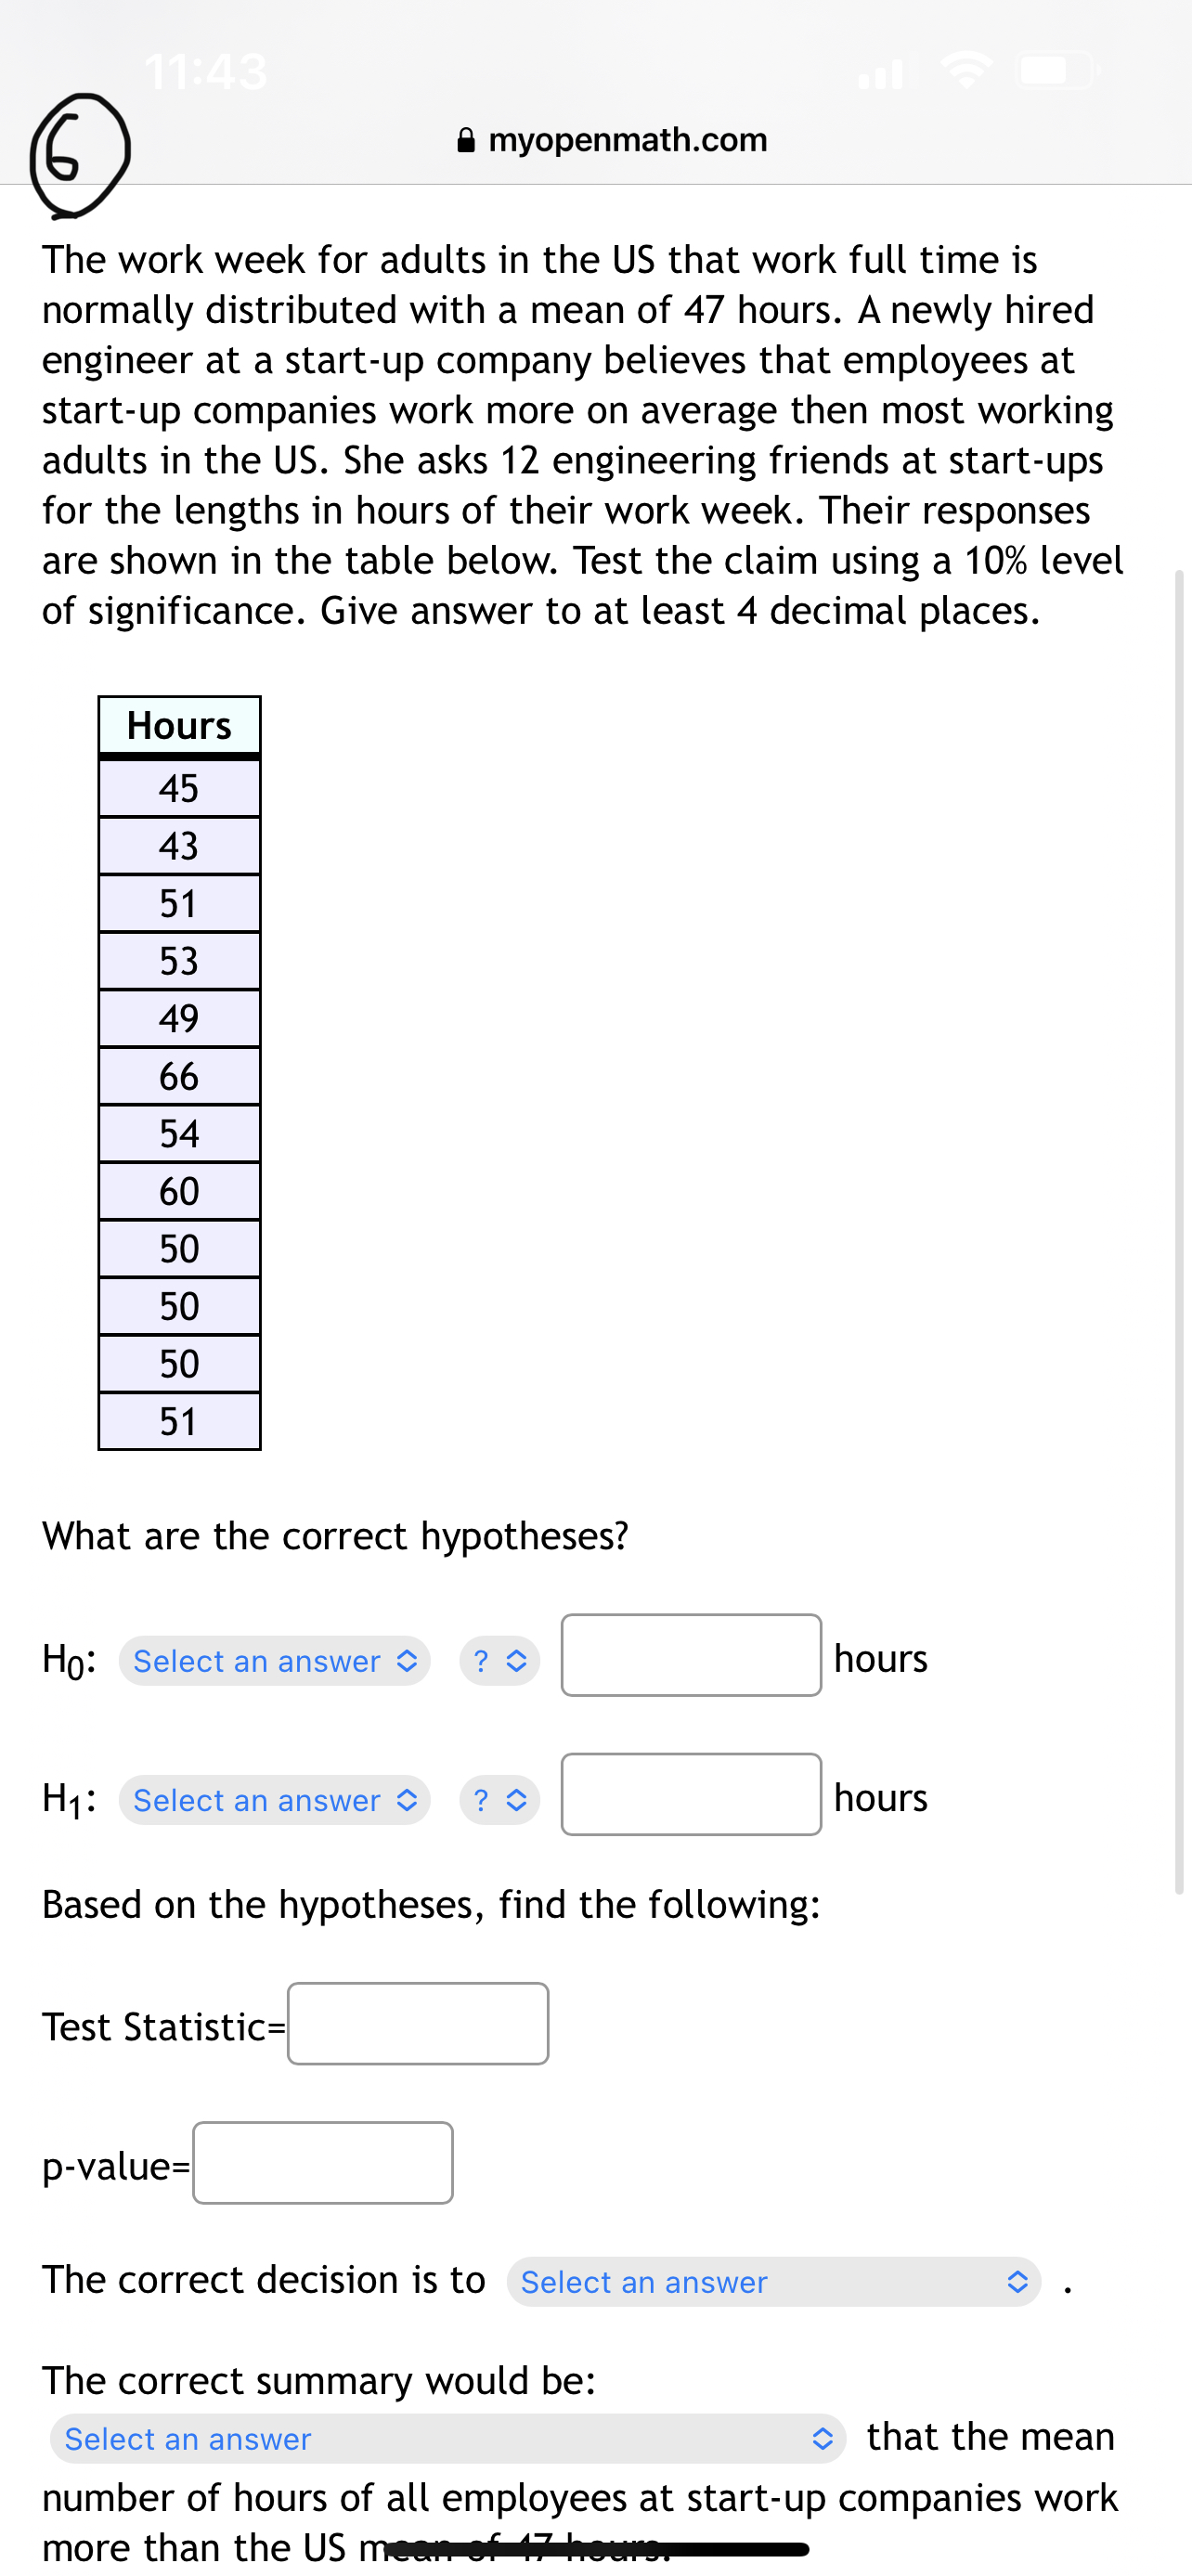
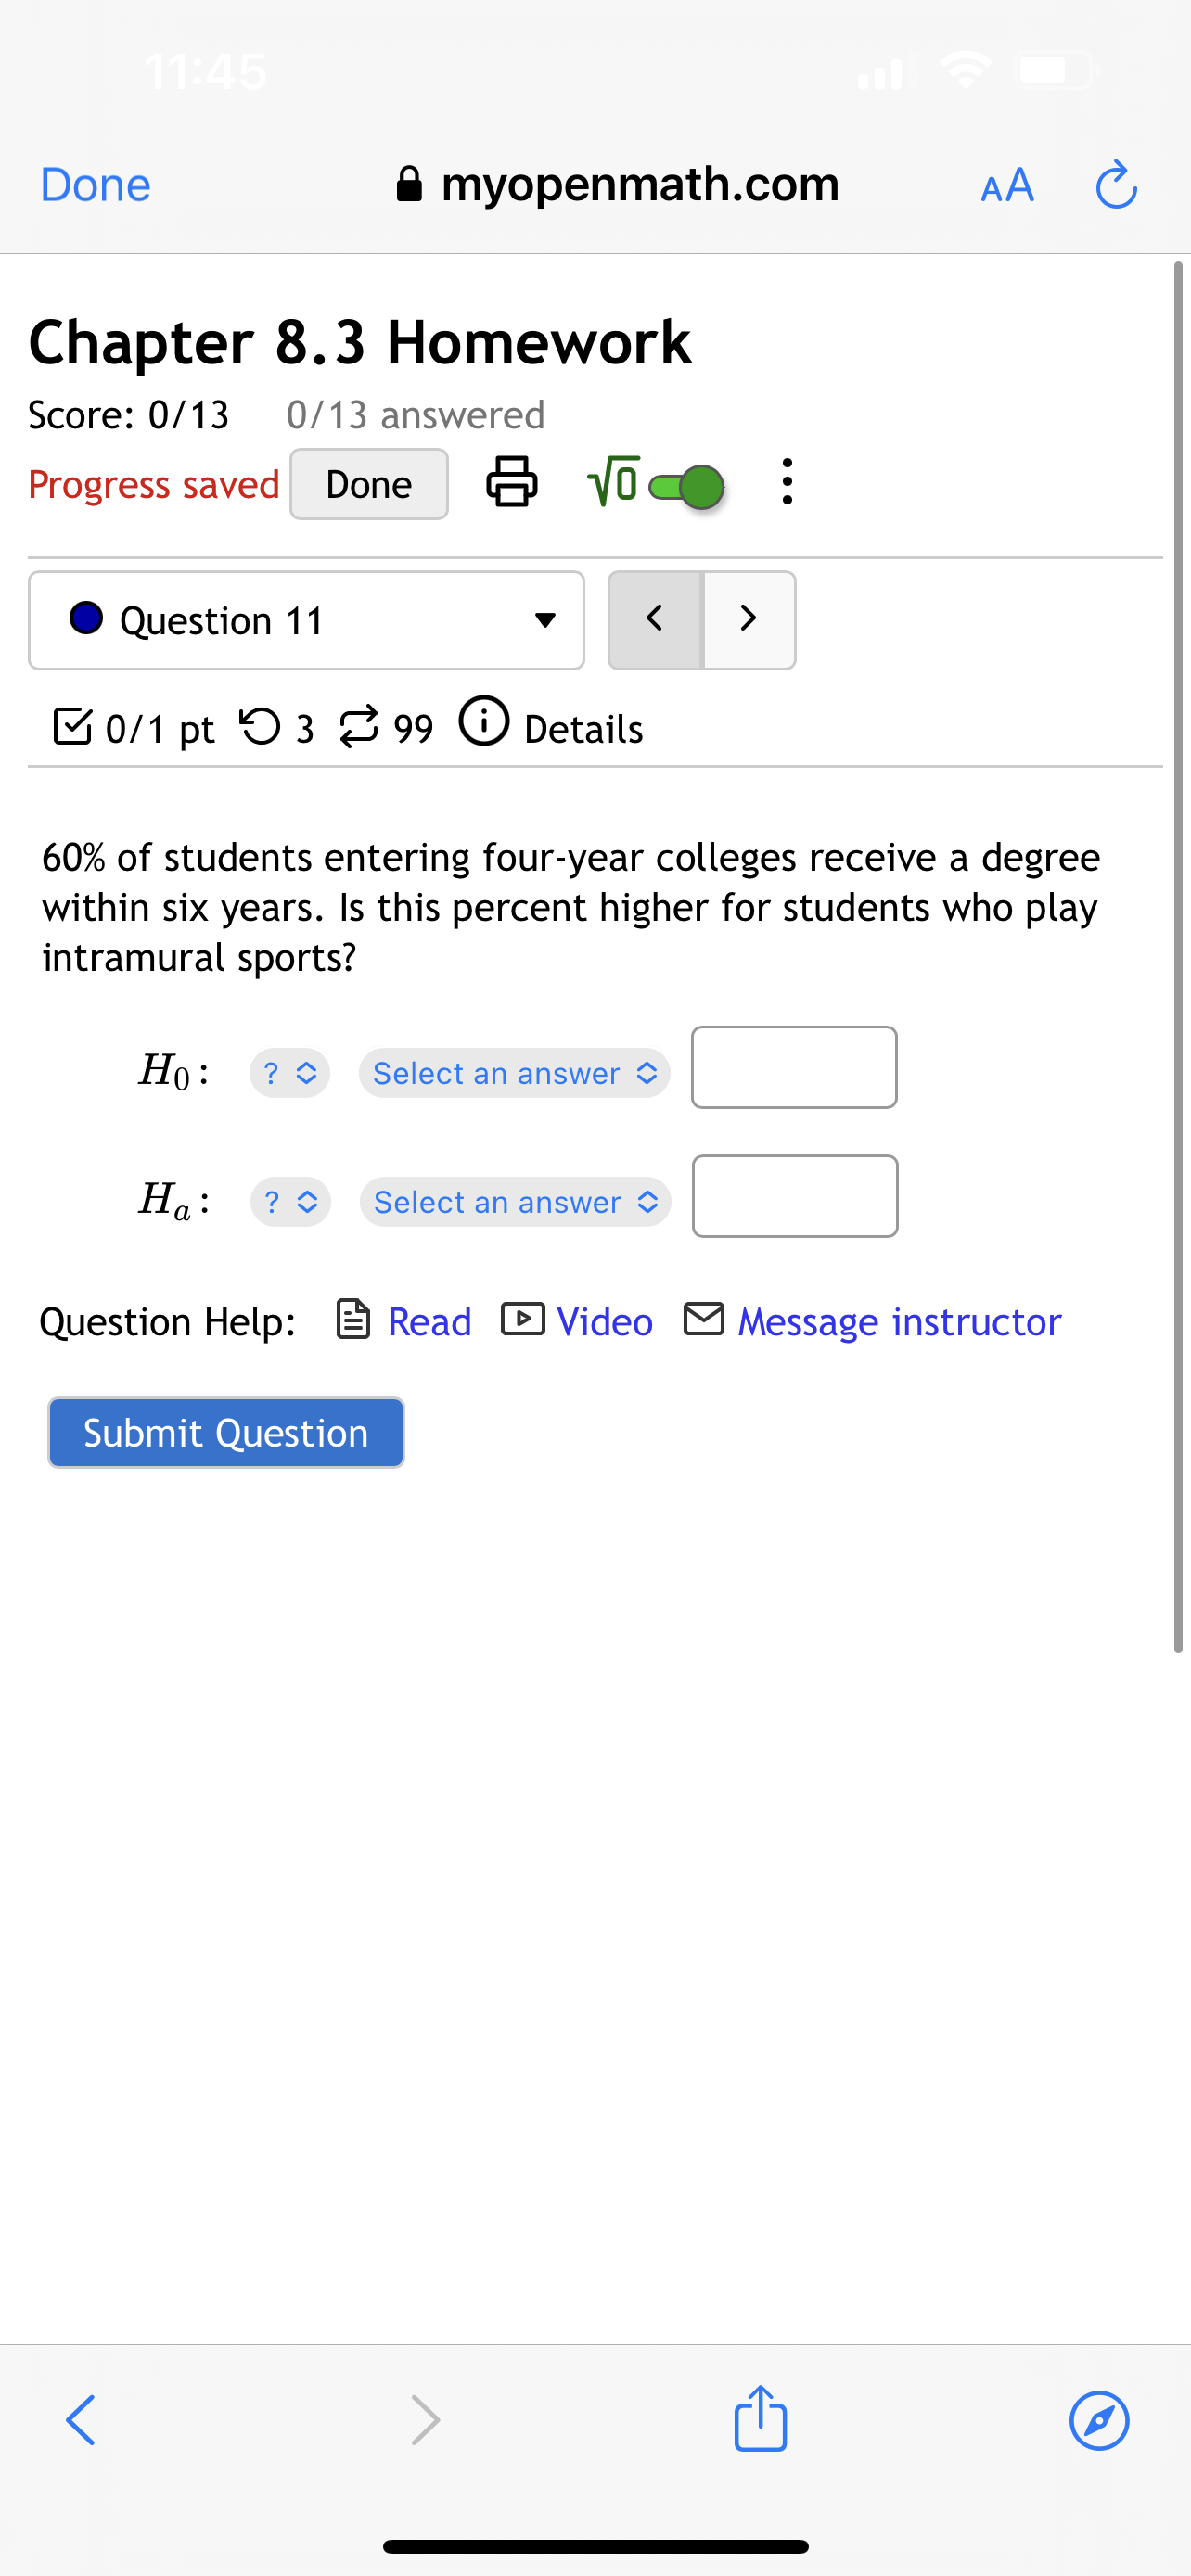
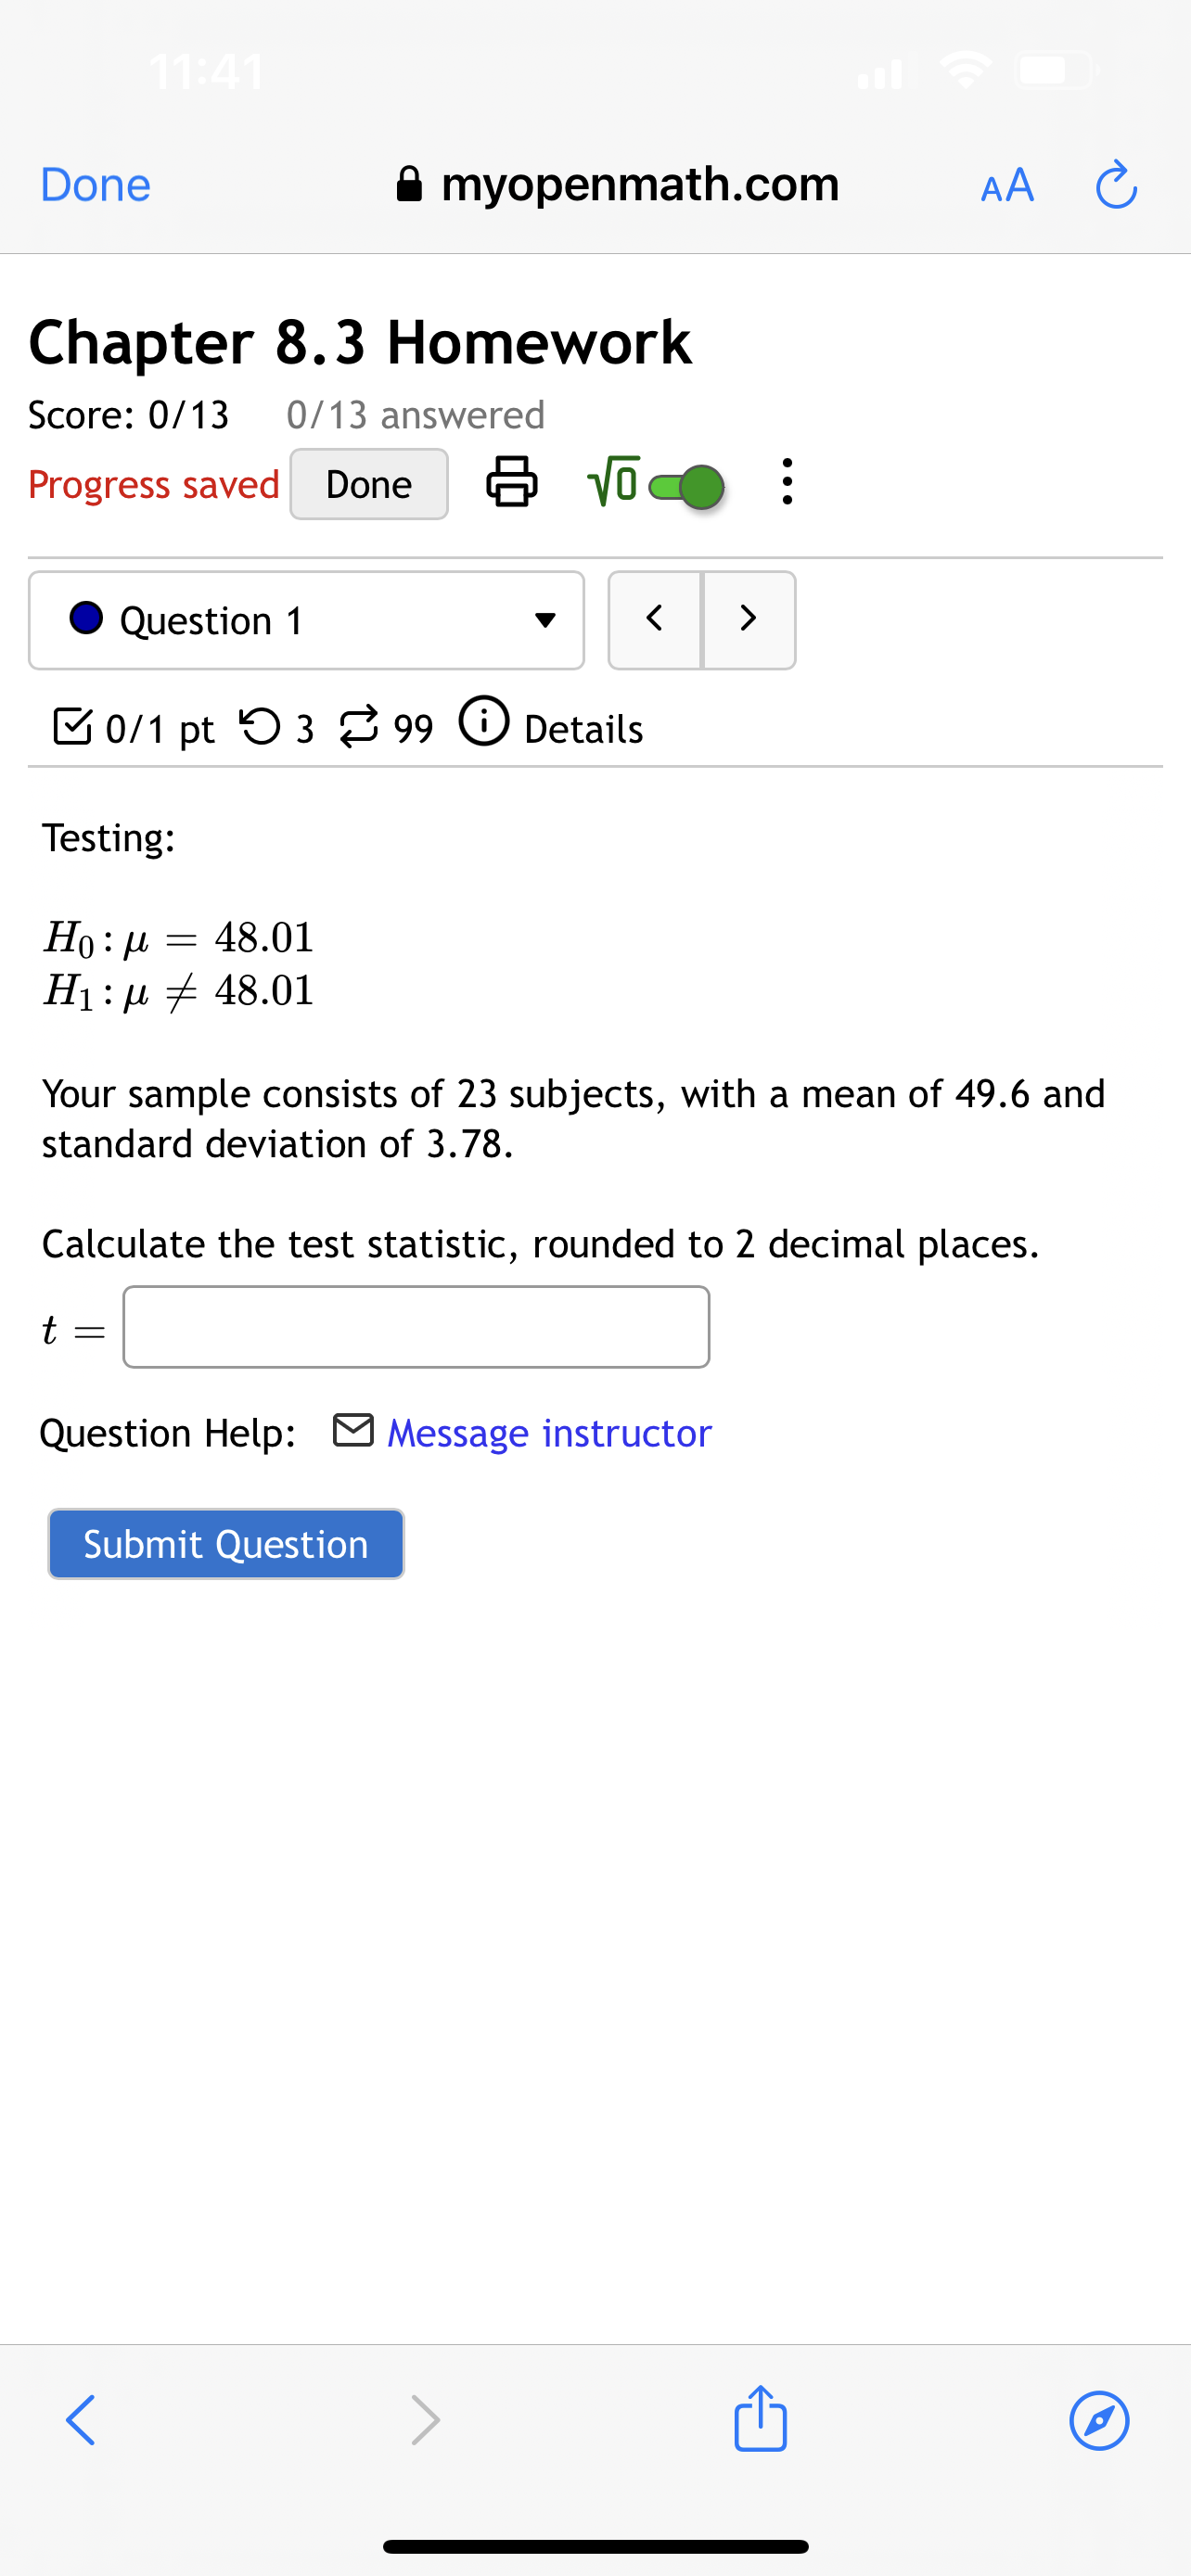
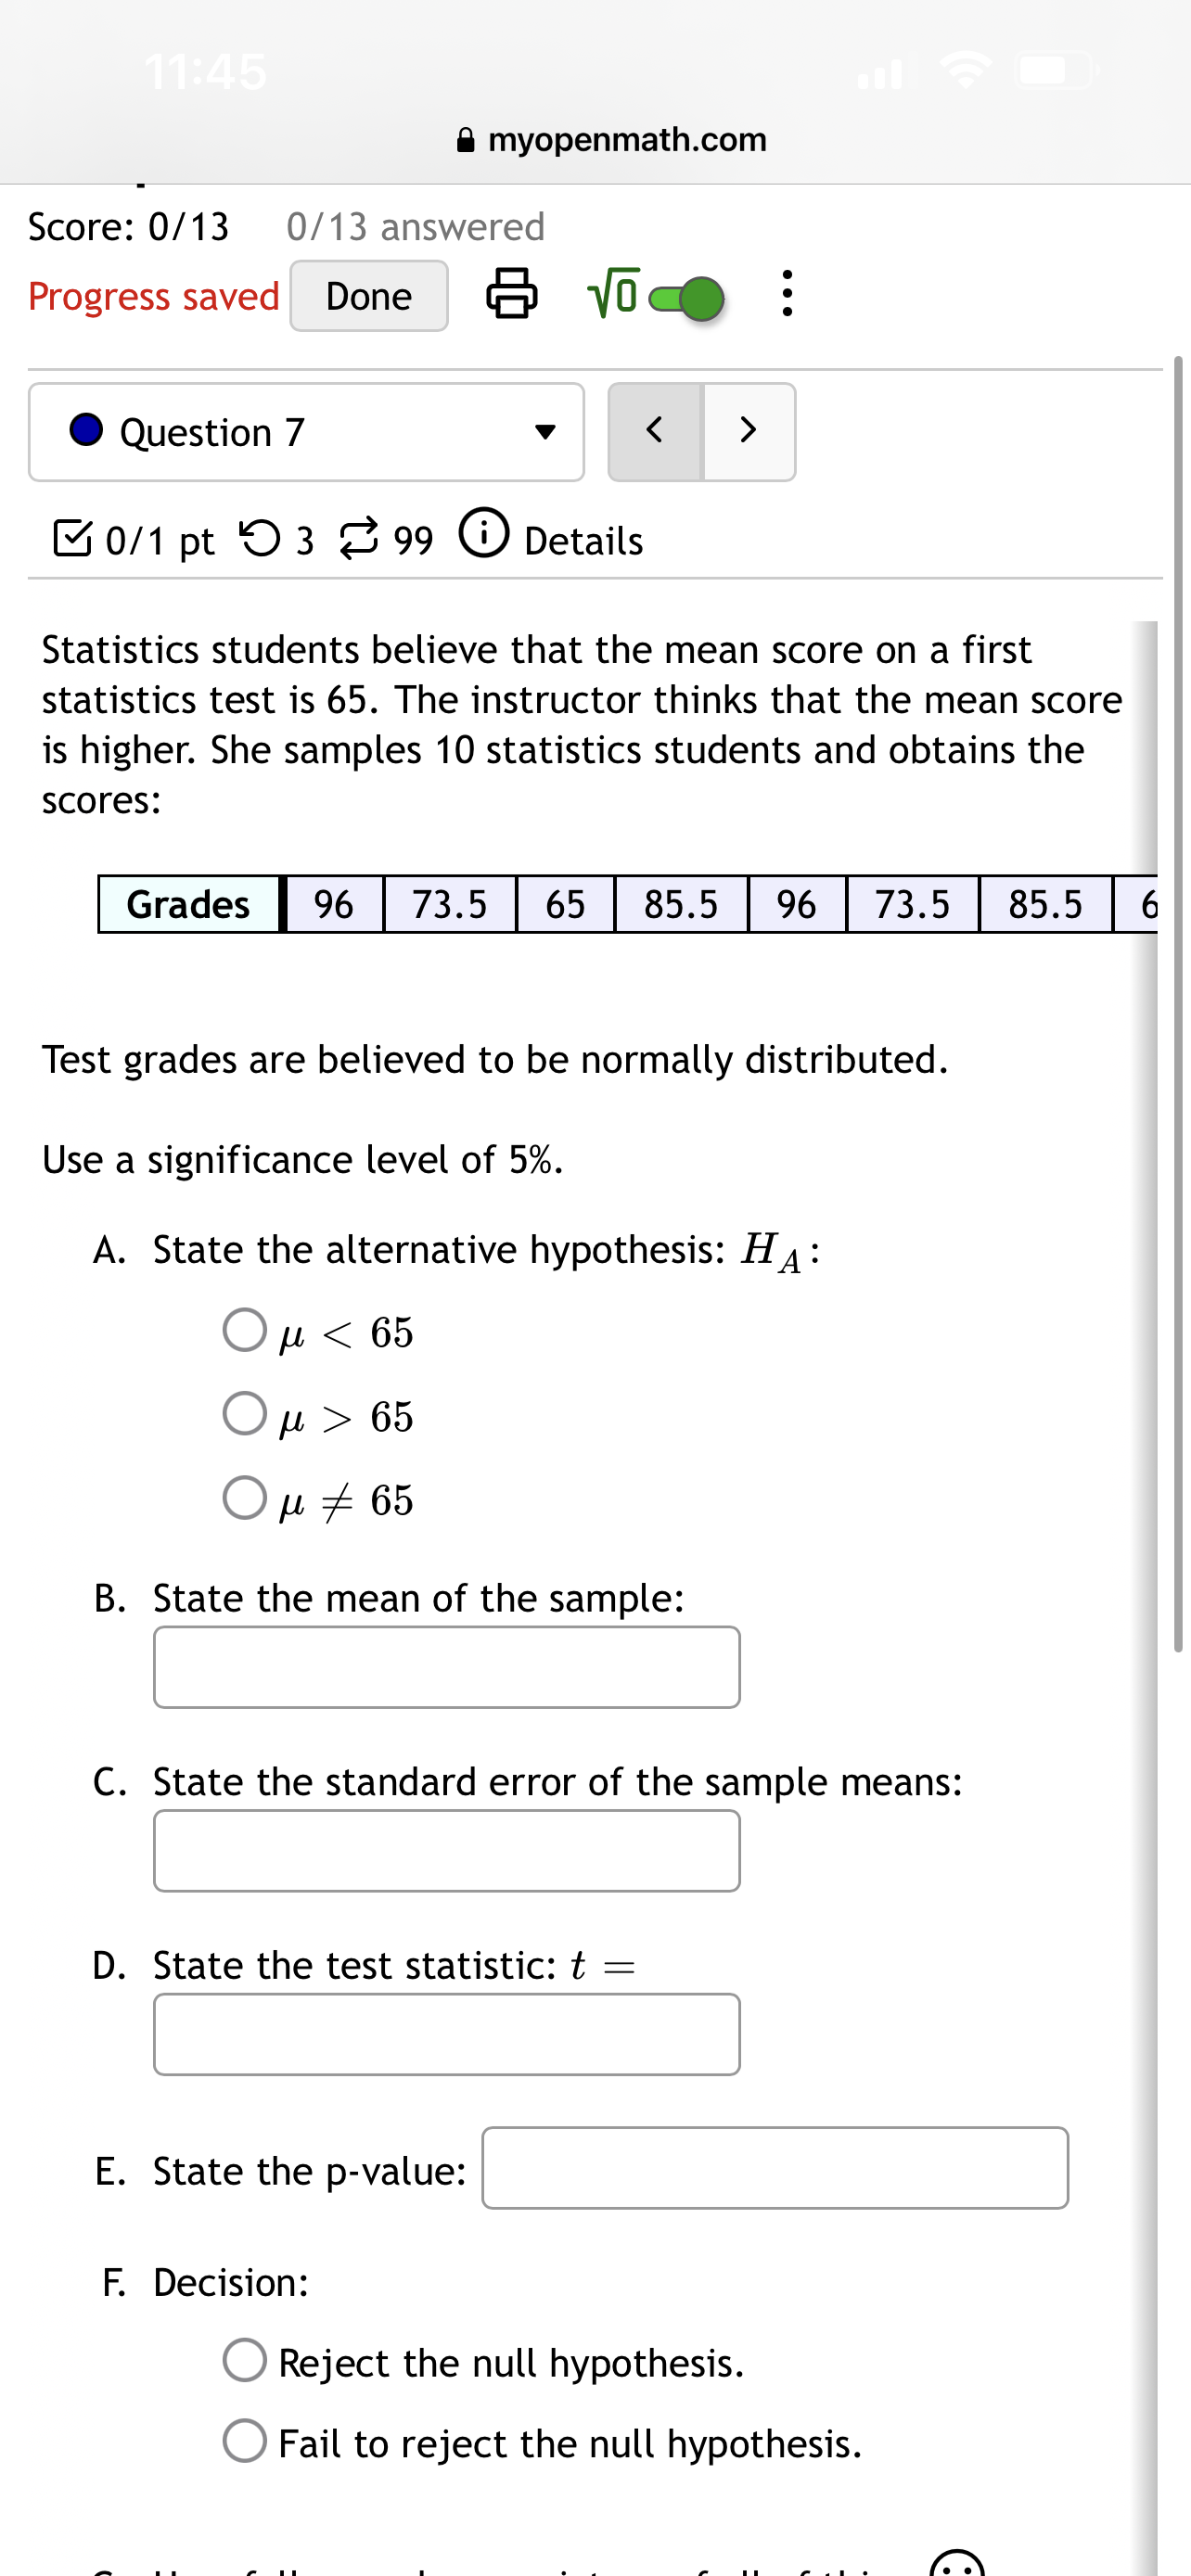
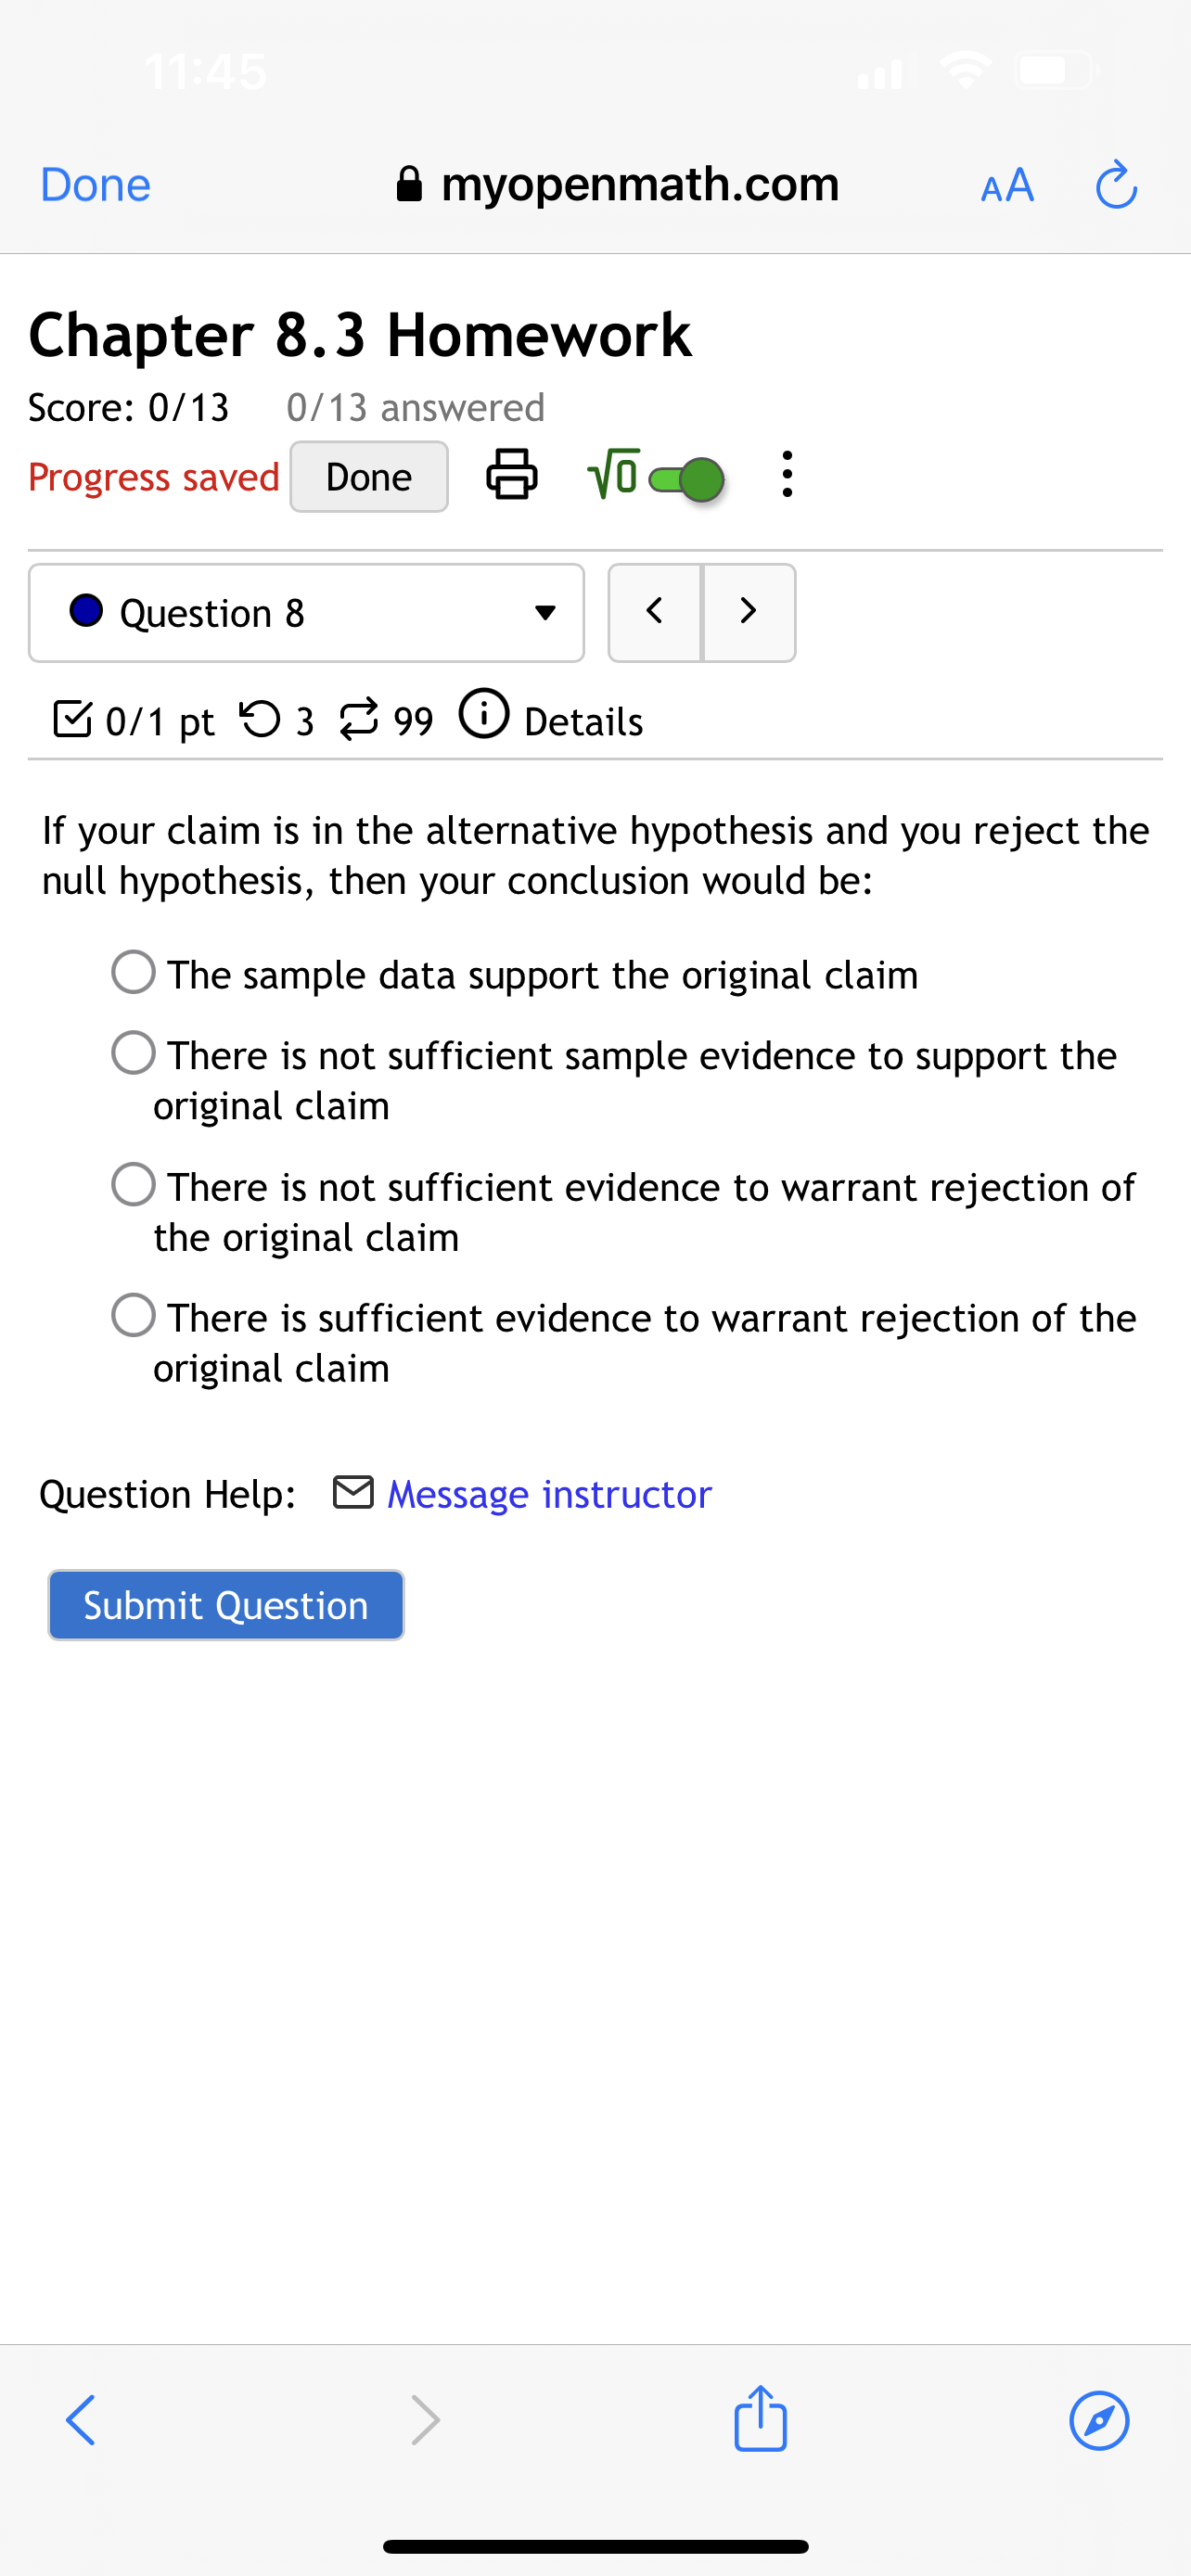
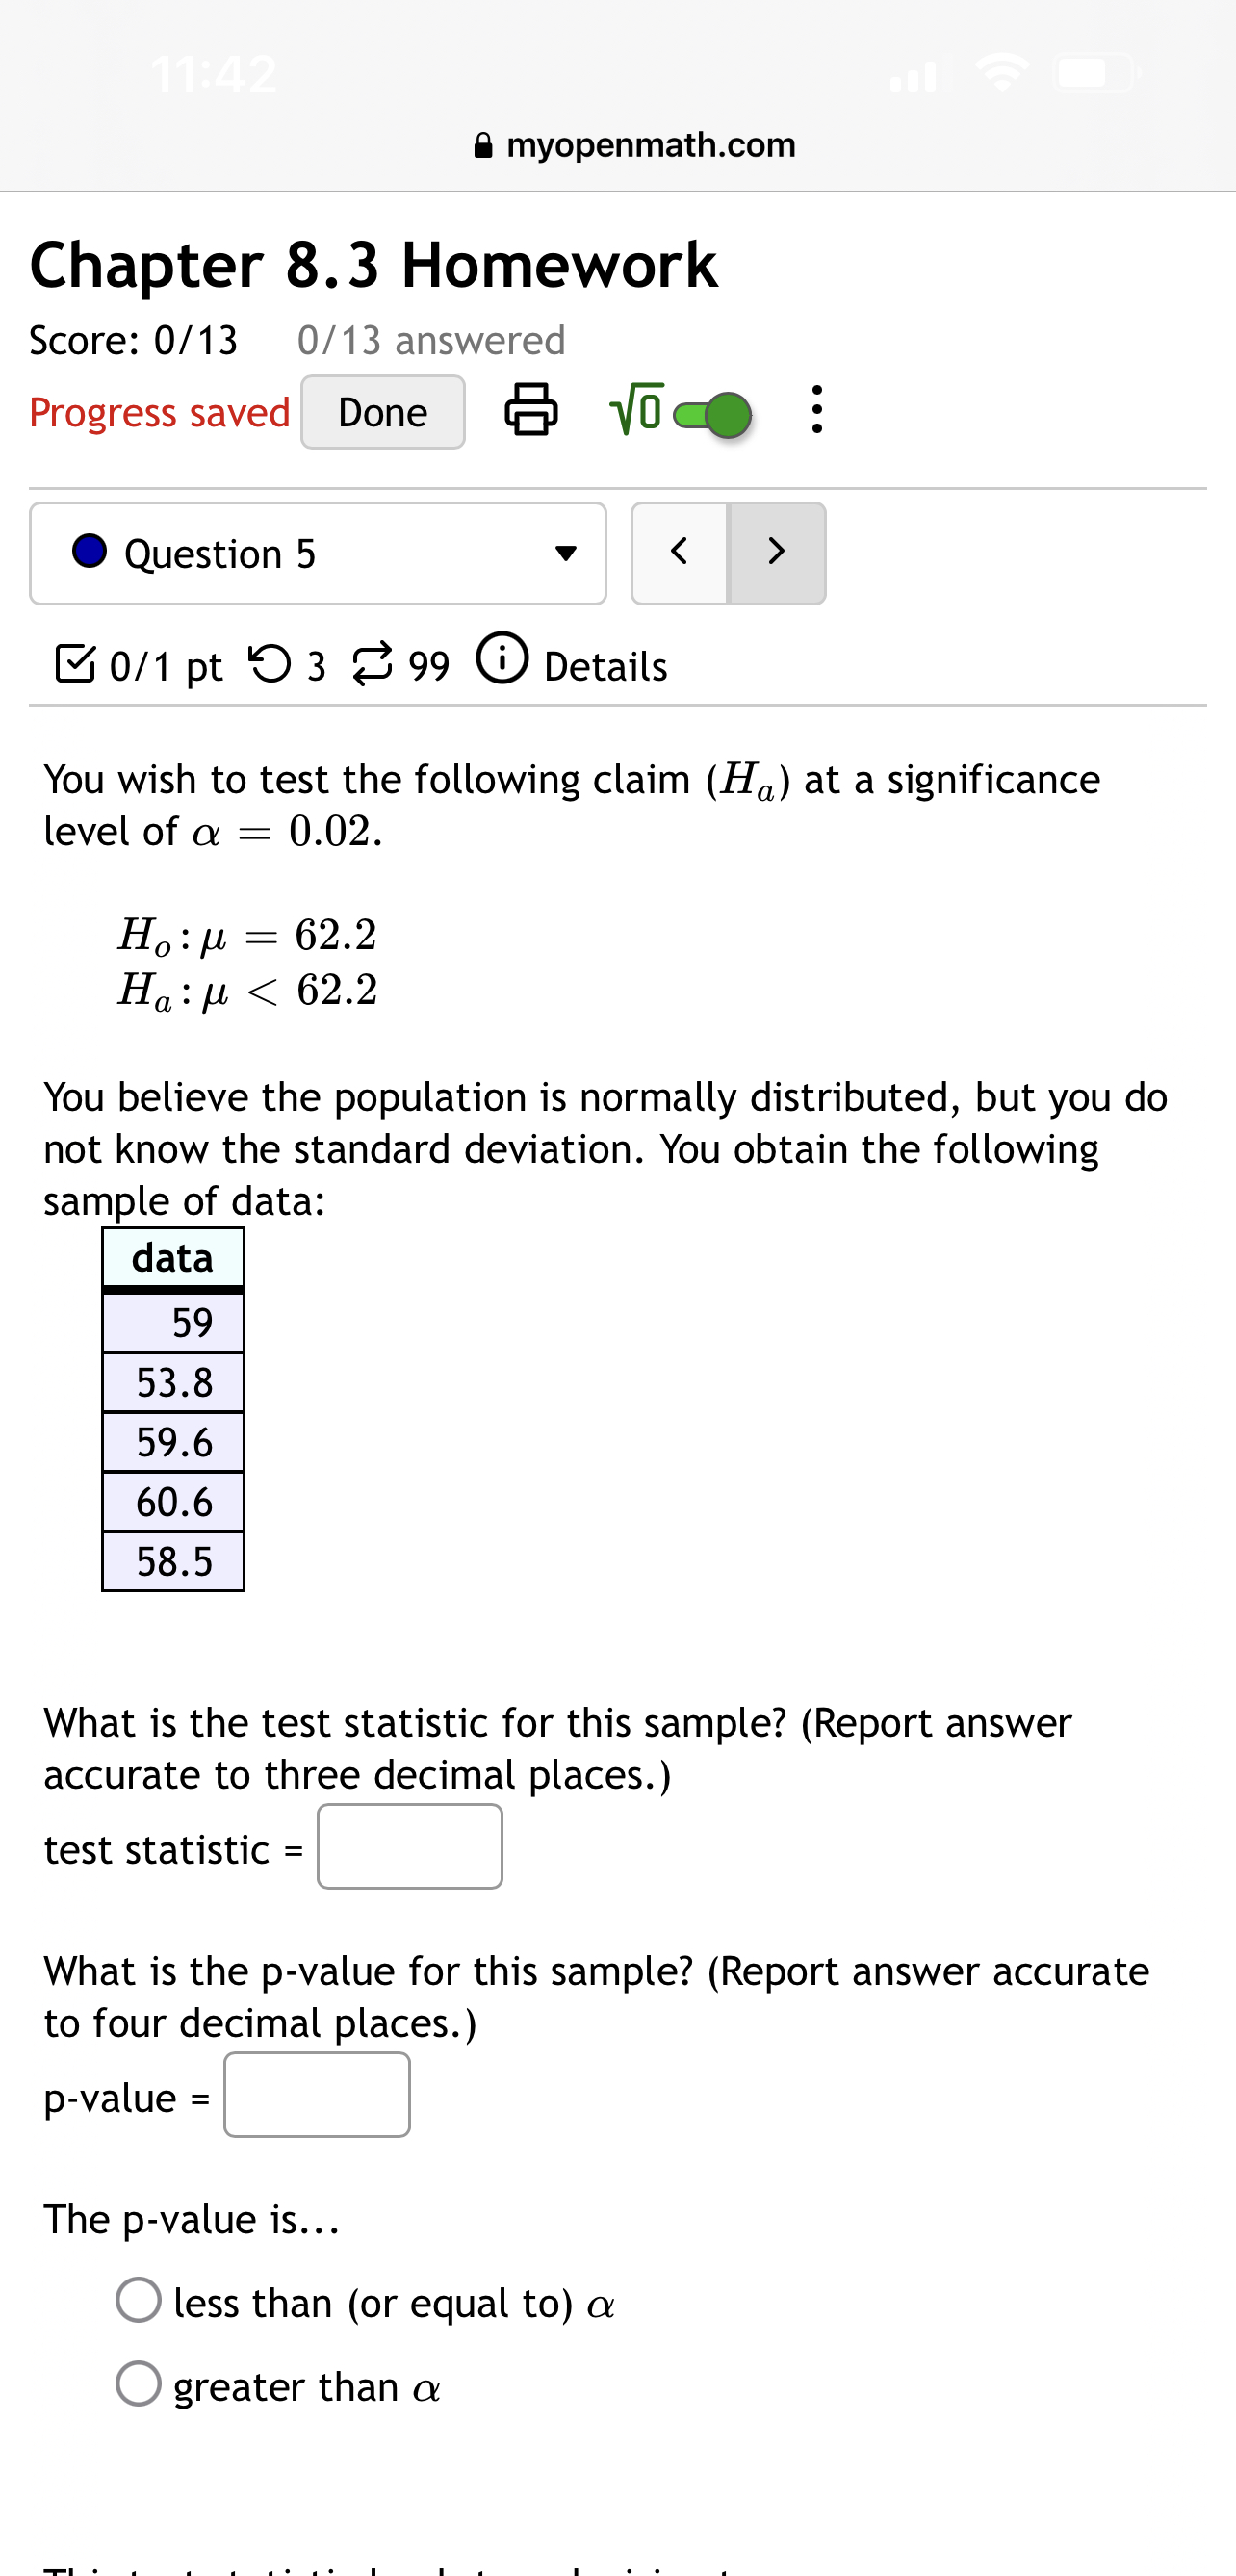
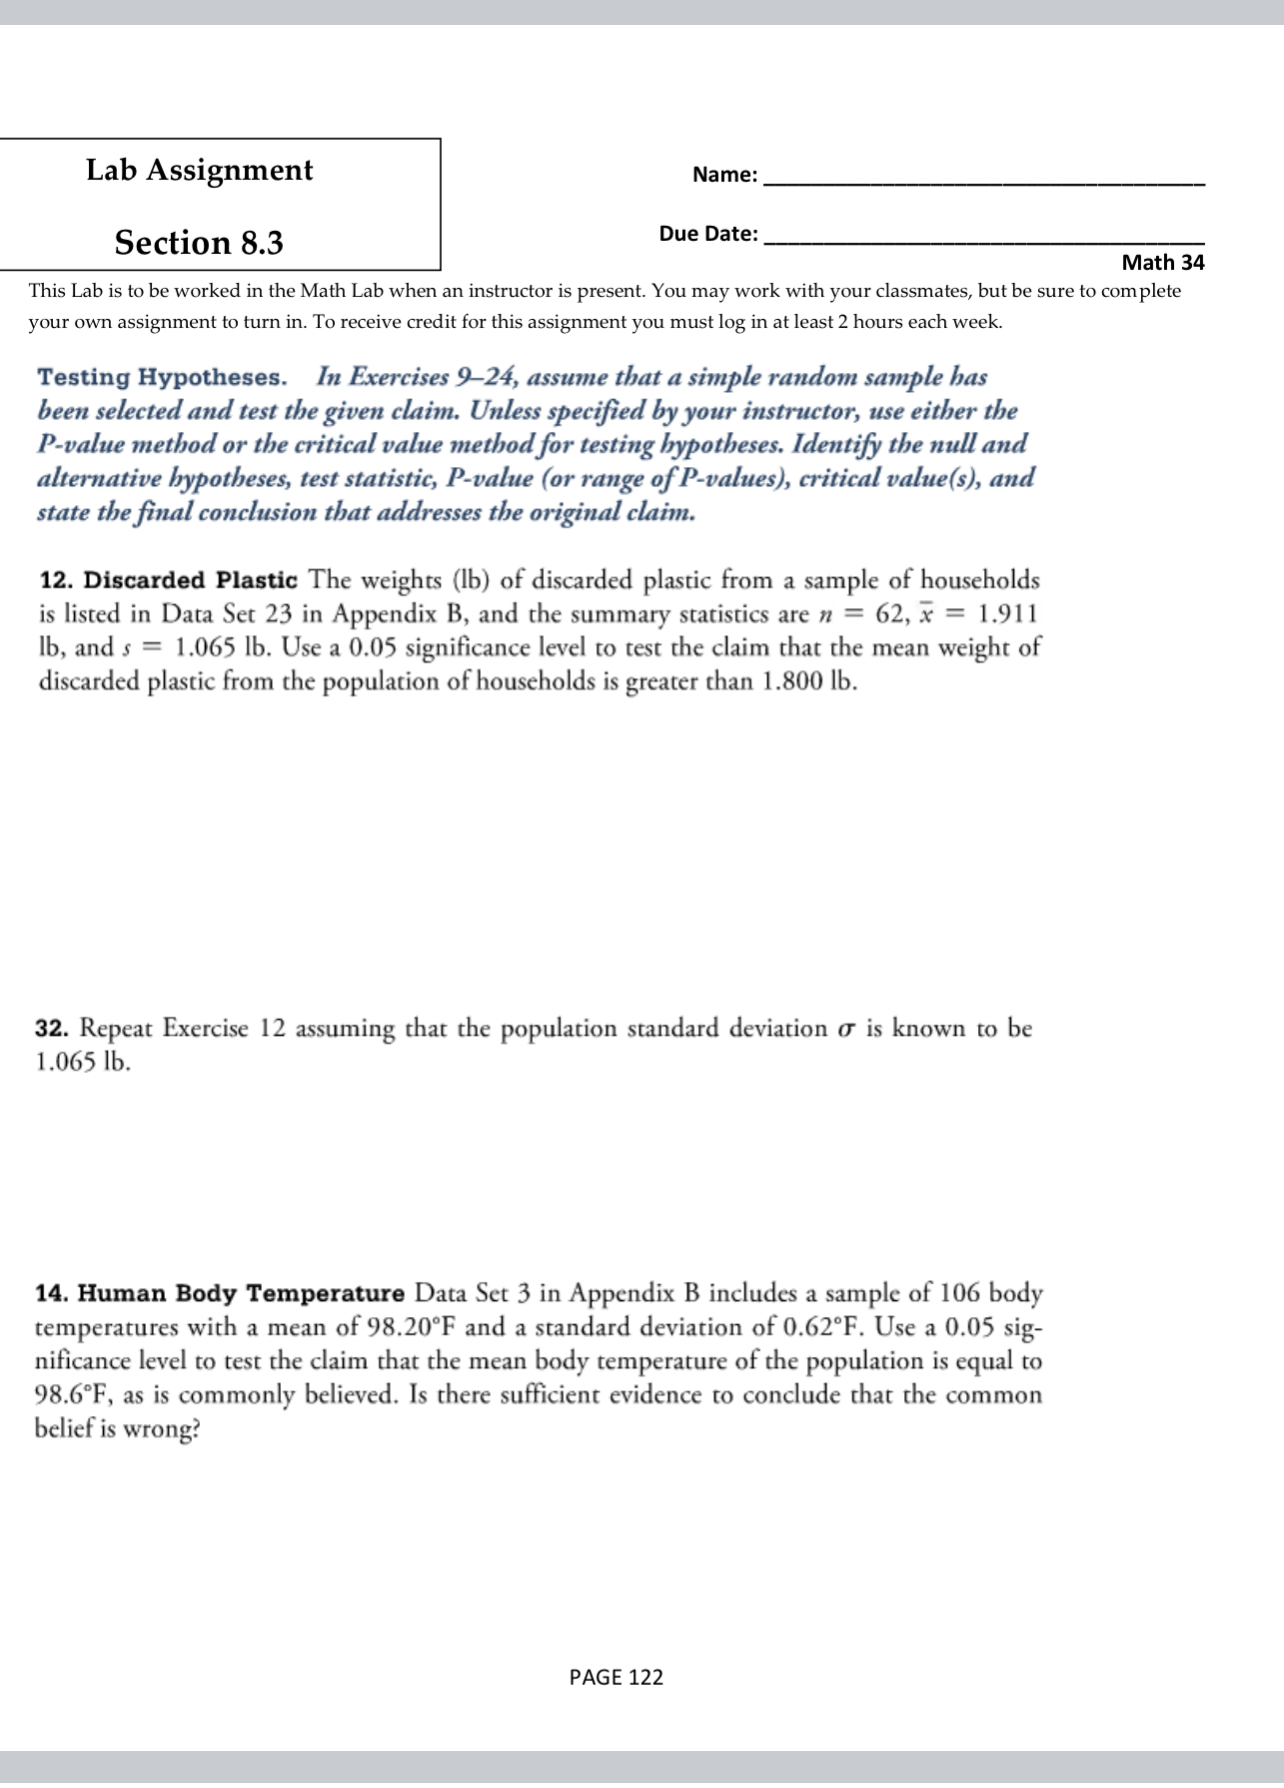
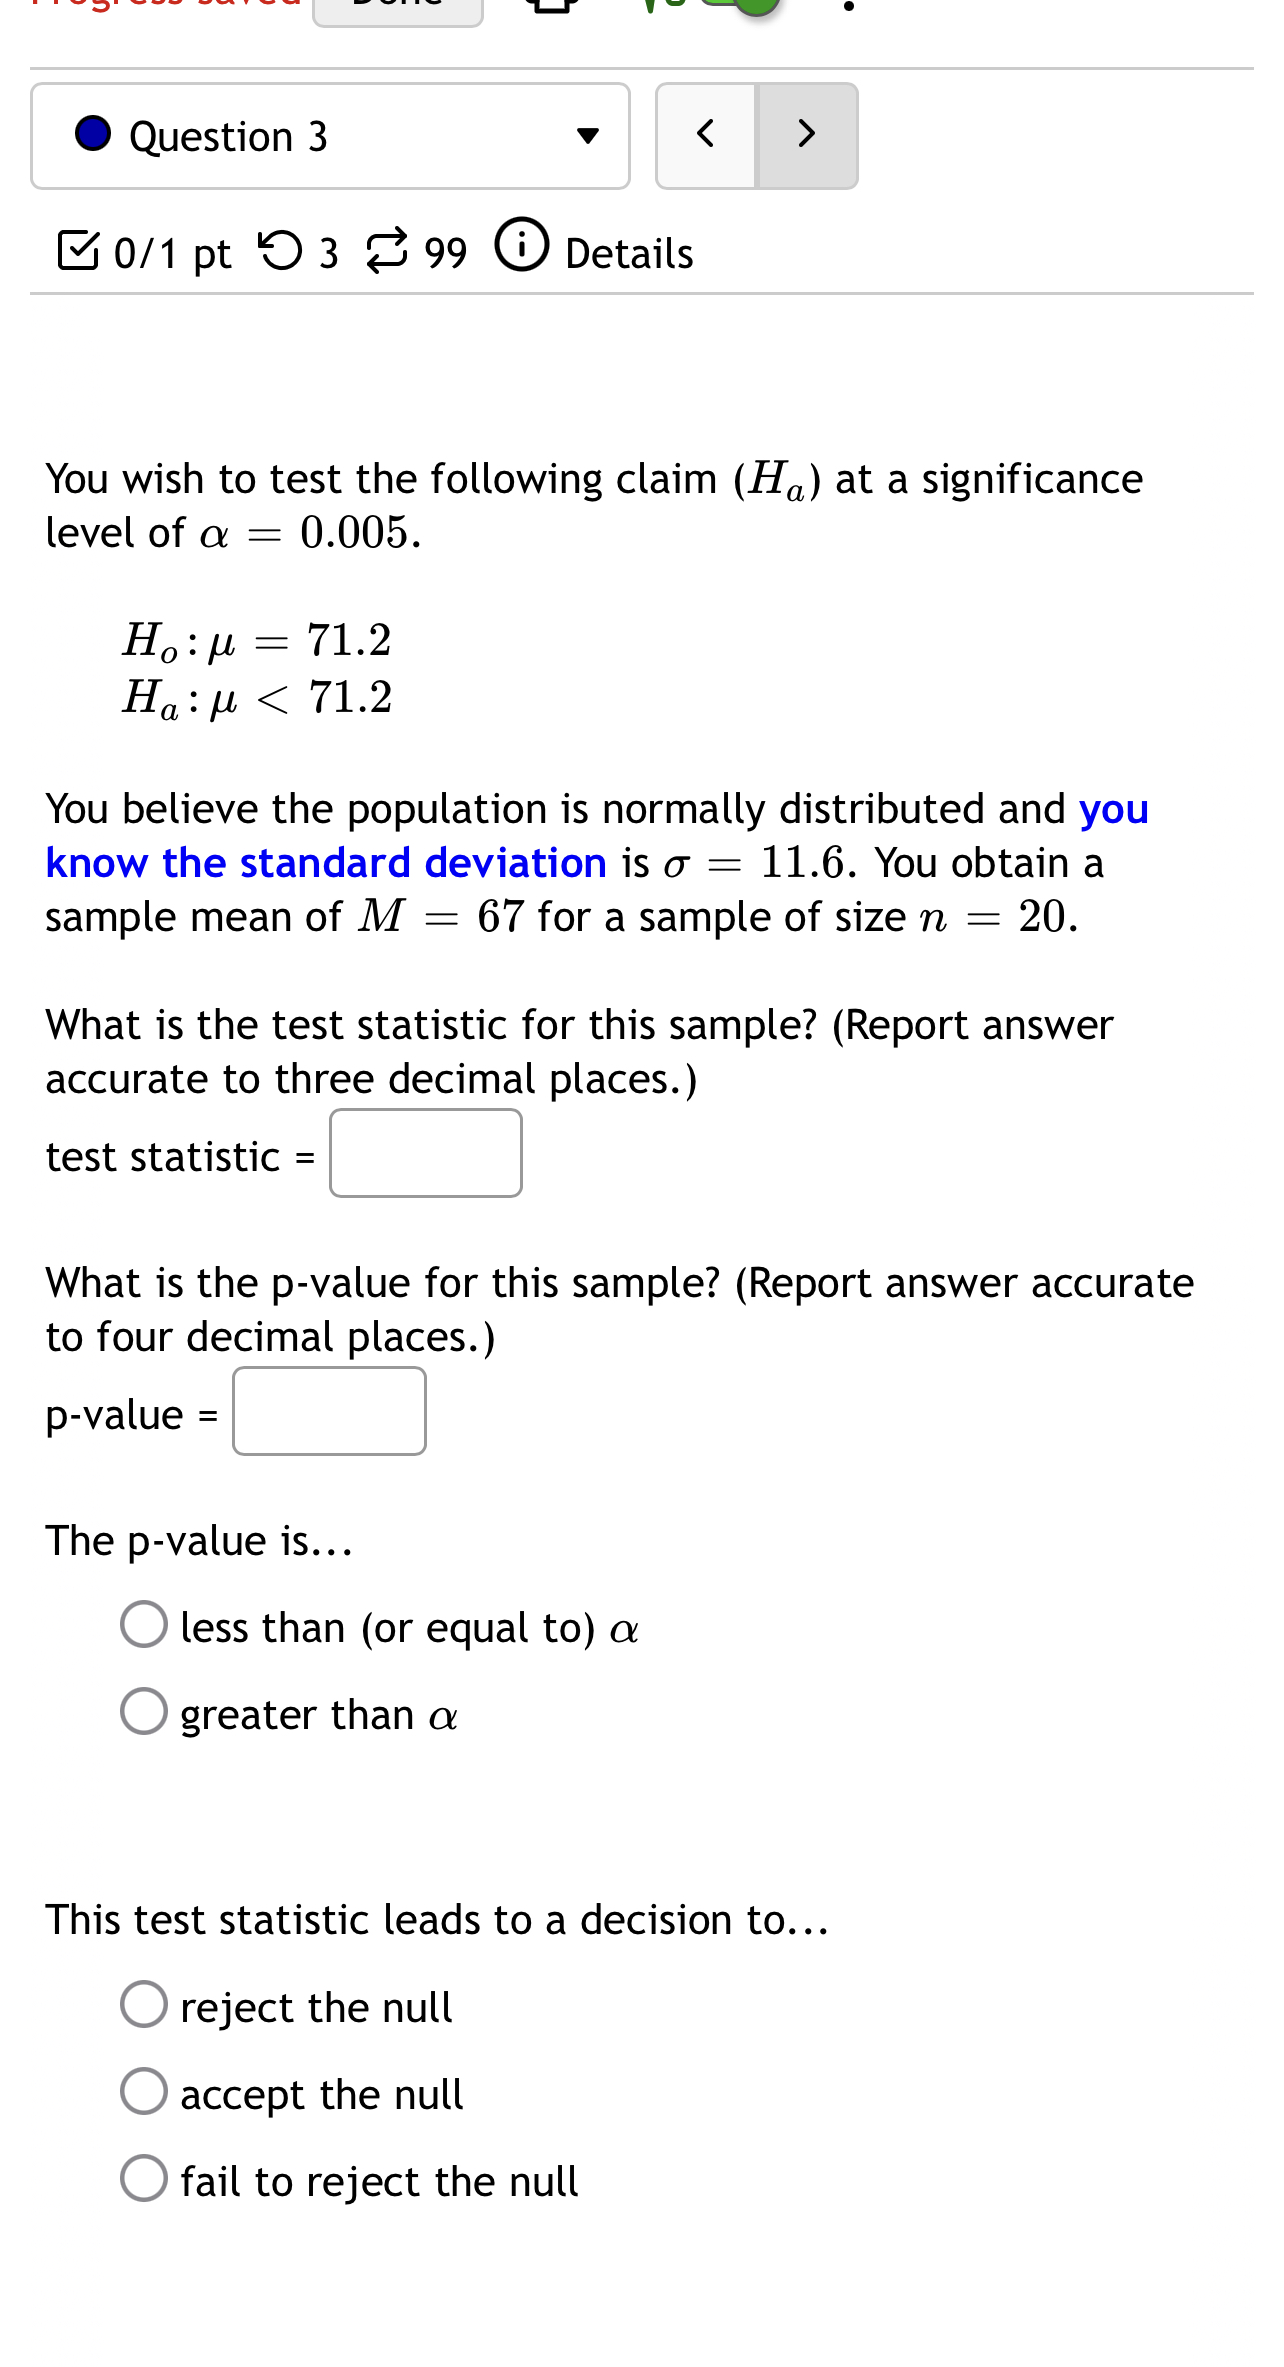
16. Flight Delays Data Set 15 in Appendix B lists 48 different departure delay times (minutes) for American Airlines flights from New York (JFK) to Los Angeles. Negative departure delay times correspond to flights that departed early. The mean of the 48 times is 10.5 min and the standard deviation is 30.8 min. Use a 0.01 significance level to test the claim that the mean departure delay time for all such flights is less than 12.0 min. Is a flight operations manager justified in reporting that the mean departure time is less than 12.0 min? 20. Ages of Race Car Drivers Listed below are the ages (years) of randomly selected race car drivers (based on data reported in USA Today). Use a 0.05 significance level to test the claim that the mean age of all race car drivers is greater than 30 years. 32 32 33 33 41 29 38 32 33 23 27 45 52 29 25 24. Highway Speeds Listed below are speeds (mi/h) measured from southbound traffic on I-280 near Cupertino, California (based on data from SigAlert). This simple random sample was obtained at 3:30 P.M. on a weekday. Use a 0.05 significance level to test the claim that the sample is from a population with a mean that is less than the speed limit of 65 mi/h. 62 61 61 57 61 54 59 58 59 69 60 67 PAGE 123i myopenmath.com Chapter 8.3 Homework Score: 0/13 0/13 answered Progress saved Done (31 VEC. 0 Question 4 v 80/1 pt '0 3 8 99 G) Details You wish to test the following claim (Ha) at a significance level of a = 0.001. H0:p 256.6 Hazy E 0/1 pt 0 3 8 99 (9 Details Test the claim that the mean GPA of night students is larger than 2.8 at the .10 significance level. The null and alternative hypothesis would be: H0:p : 0.7 H0:/,L : 2.8 How, : 2.8 H0:p : 0.7 H121) 2.8 H1211, 0.7 O O O O H0:,u= 2.8 Hozpz 0.7 H1:,u7 2.8 lep7 0.7 O O The testis: two-tailed right-tailed left-tailed O O O Based on a sample of 65 people, the sample mean GPA was 2.81 with a standard deviation of 0.03 The test statistic is: (to 2 decimals) The critical value is: (to 2 decimals) Based on this we: O Fail to reject the null hypothesis 0 Reject the null hypothesis Question Help: 8 Message instructor H myopenmath.com The work week for adults in the US that work full time is normally distributed with a mean of 47 hours. A newly hired engineer at a start-up company believes that employees at start-up companies work more on average then most working adults in the US. She asks 12 engineering friends at start-ups for the lengths in hours of their work week. Their responses are shown in the table below. Test the claim using a 10% level of significance. Give answer to at least 4 decimal places. What are the correct hypotheses? 0 ~o 0 H0! Select an answer hours (> ~o 0 H12 Select an answer hours Based on the hypotheses, find the following: Test Statistic= p-value= The correct decision is to Select an answer 0 The correct summary would be: Select an answer 0 that the mean number of hours of all employees at start-up companies work more than the US thuu-m Done 3 myopenmath.com AA (3 Chapter 8.3 Homework Score: 0/13 0/13 answered Progress saved Done (a) WC. 0 Question 11 v 80/1 pt '0 3 8 99 G) Details 60% of students entering four-year colleges receive a degree within six years. Is this percent higher for students who play intramural sports? H0: ? 0 Select an answer 0 S Ha: ? G Select an answer 3 S Question Help: Q Read El Video 8 Message instructor Submit Question Done 6 myopenmath.com AA (3 Chapter 8.3 Homework Score: 0/13 0/13 answered Progress saved Done (3) wlc. 0 Question 1 v IZO/1 pt '0 3 8 99 G) Details Testing: H0 : p, : 48.01 H1:p, 75 48.01 Your sample consists of 23 subjects, with a mean of 49.6 and standard deviation of 3.78. Calculate the test statistic, rounded to 2 decimal places. it: Question Help: 8 Message instructor Submit Question i myopenmath.com Score: 0/13 0/13 answered Progress saved Done (31 EC. 0 Question 7 v l3 0/1 pt '0 3 8 99 G) Details Statistics students believe that the mean score on a first statistics test is 65. The instructor thinks that the mean score is higher. She samples 10 statistics students and obtains the scores: -m---\" 6 Test grades are believed to be normally distributed. Use a significance level of 5%. A. State the alternative hypothesis: H A: Op% Op#% B. State the mean of the sample: C. State the standard error of the sample means: D. State the test statistic: t : E. State the p-value: F. Decision: 0 Reject the null hypothesis. 0 Fail to reject the null hypothesis. Done 6 myopenmath.com AA (3 Chapter 8.3 Homework Score: 0/13 0/13 answered Progress saved Done 6 Wlc. 0 Question 8 v l3 0/1 pt '0 3 8 99 6) Details If your claim is in the alternative hypothesis and you reject the null hypothesis, then your conclusion would be: 0 The sample data support the original claim 0 There is not sufficient sample evidence to support the original claim 0 There is not sufficient evidence to warrant rejection of the original claim 0 There is sufficient evidence to warrant rejection of the original claim Question Help: 8 Message instructor Submit Question myopenmath.oom Chapter 8.3 Homework Score: 0/13 0/13 answered Progress saved Done {El}! WC. 0 Question 5 v E 0/1 pt '0 3 8 99 (D Details You wish to test the following claim (Ha) at a significance level of oz : 0.02. Hazy : 62.2 Haul Ill/on pt '0 3 8 99 6) Details You wish to test the following claim (Ha) at a significance level of oz : 0.005. Hana = 71.2 Hazy
Step by Step Solution
There are 3 Steps involved in it

Get step-by-step solutions from verified subject matter experts